Compare Tool is a feature within the VIRTEST Scheduler that lets engineers monitor active test runs, analyze log output, and compare results from multiple test cases, all without leaving the platform. Rather than exporting logs to external viewers and manually cross-referencing verdicts in a spreadsheet, engineers can move from run status to root cause inside a single workflow.
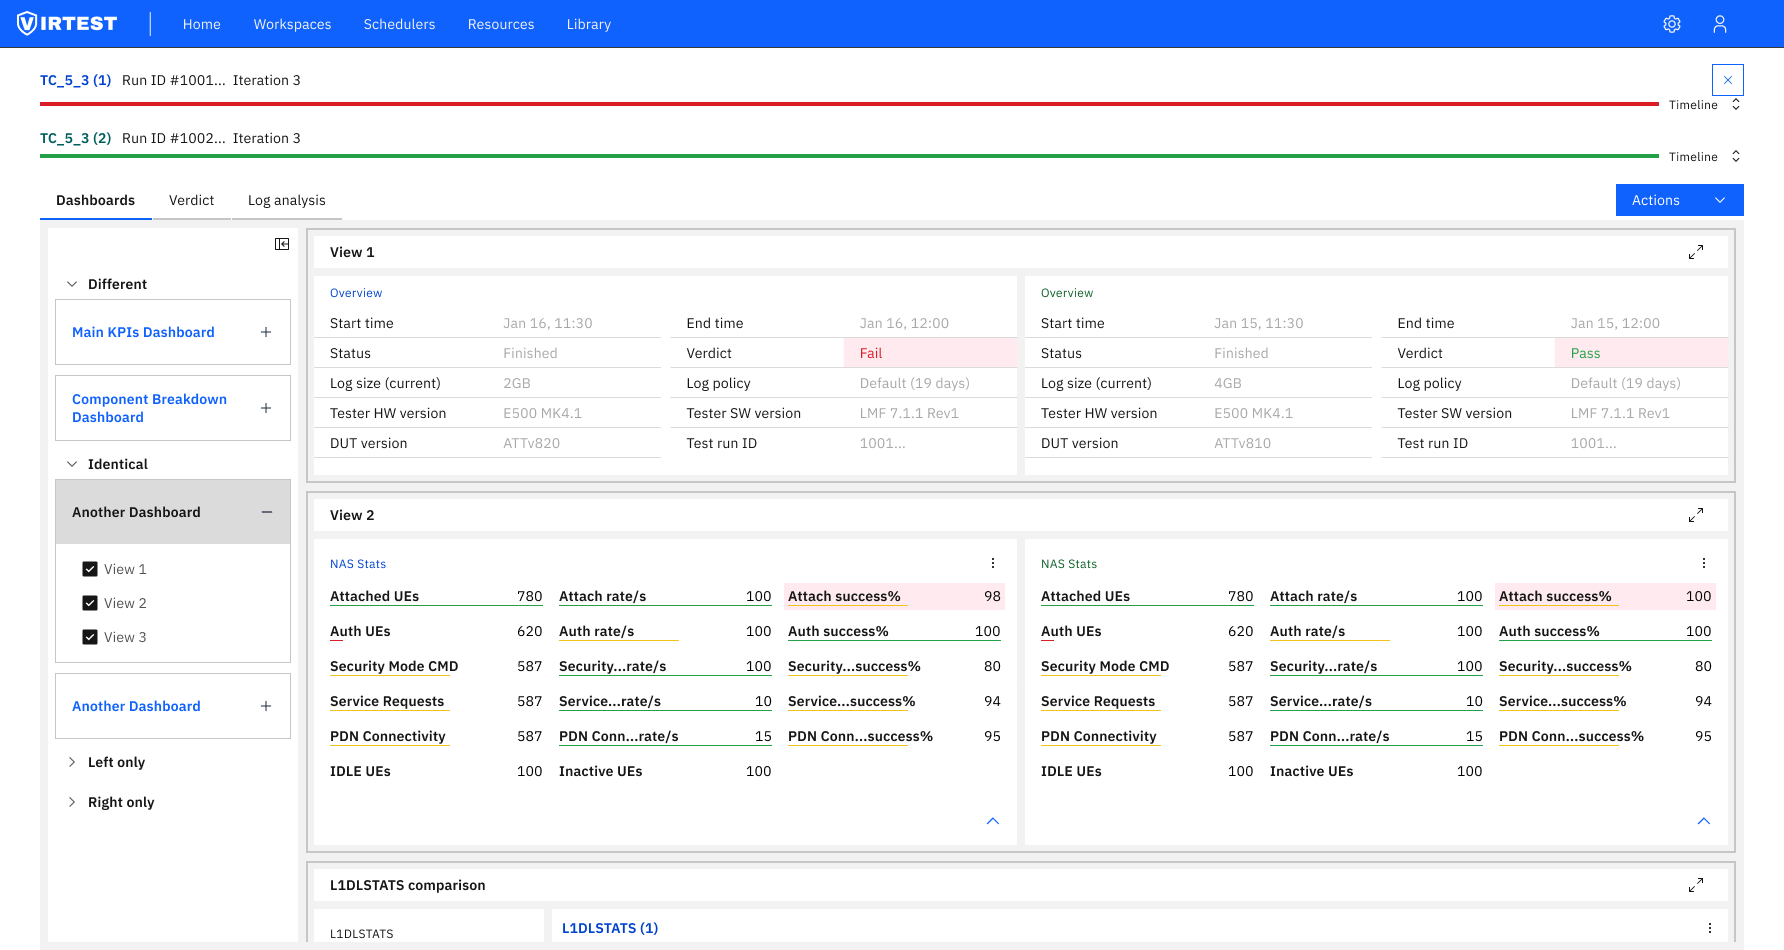
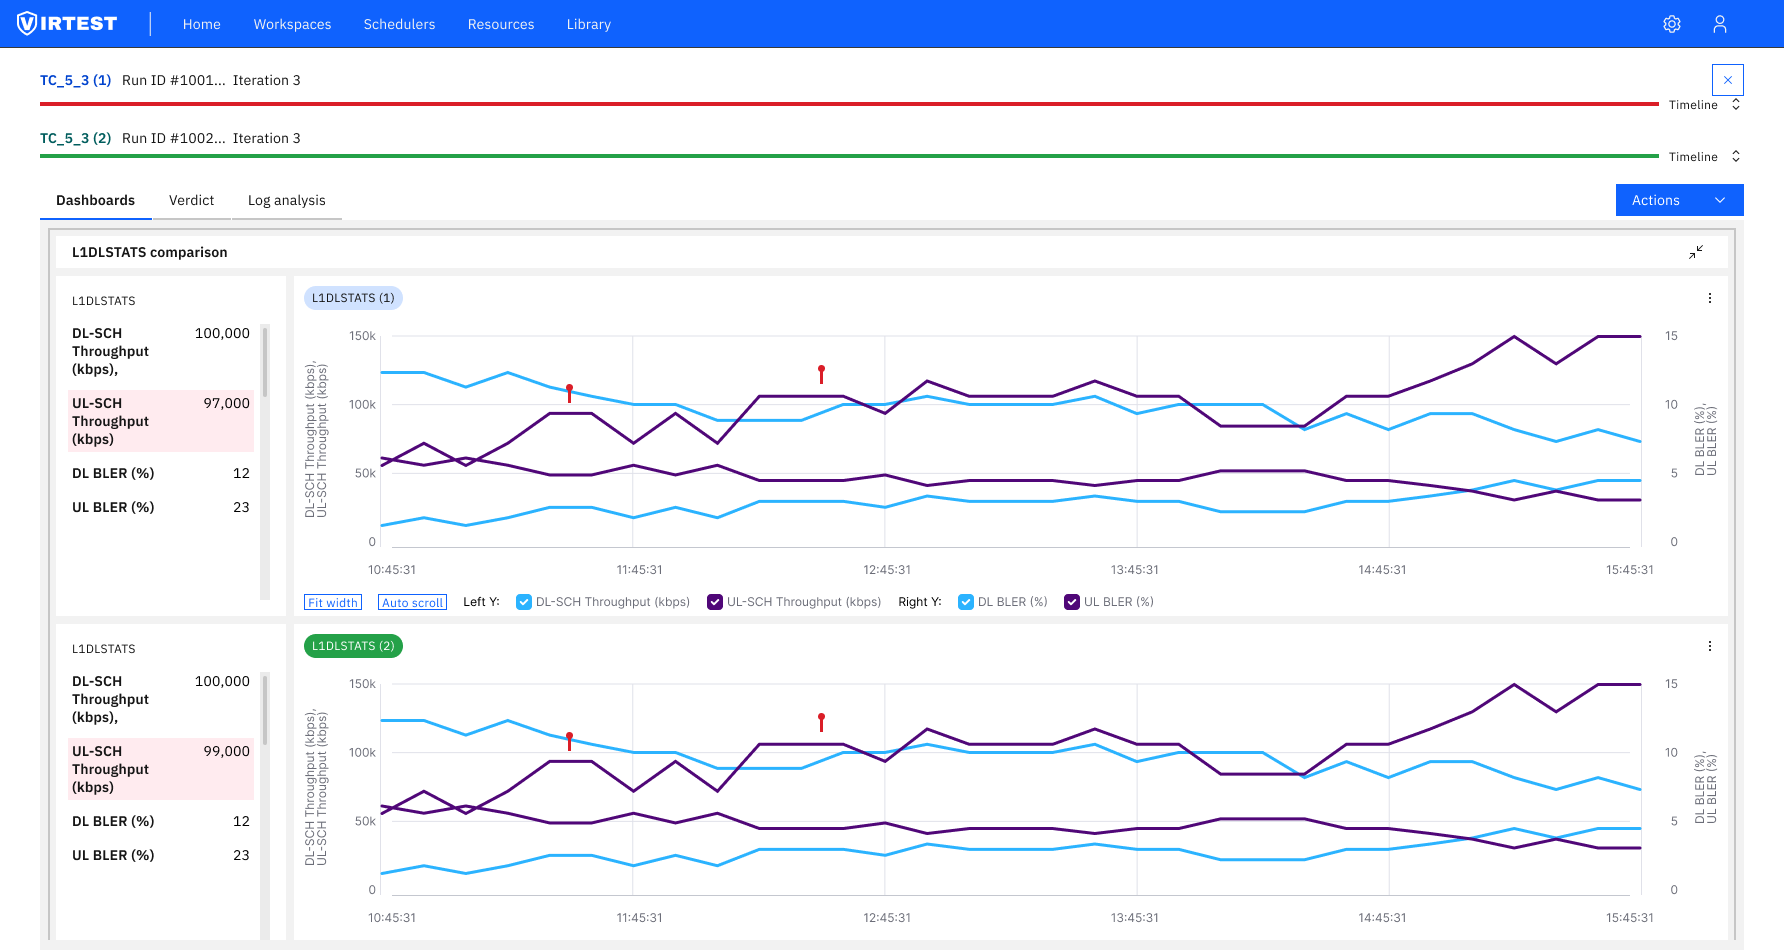
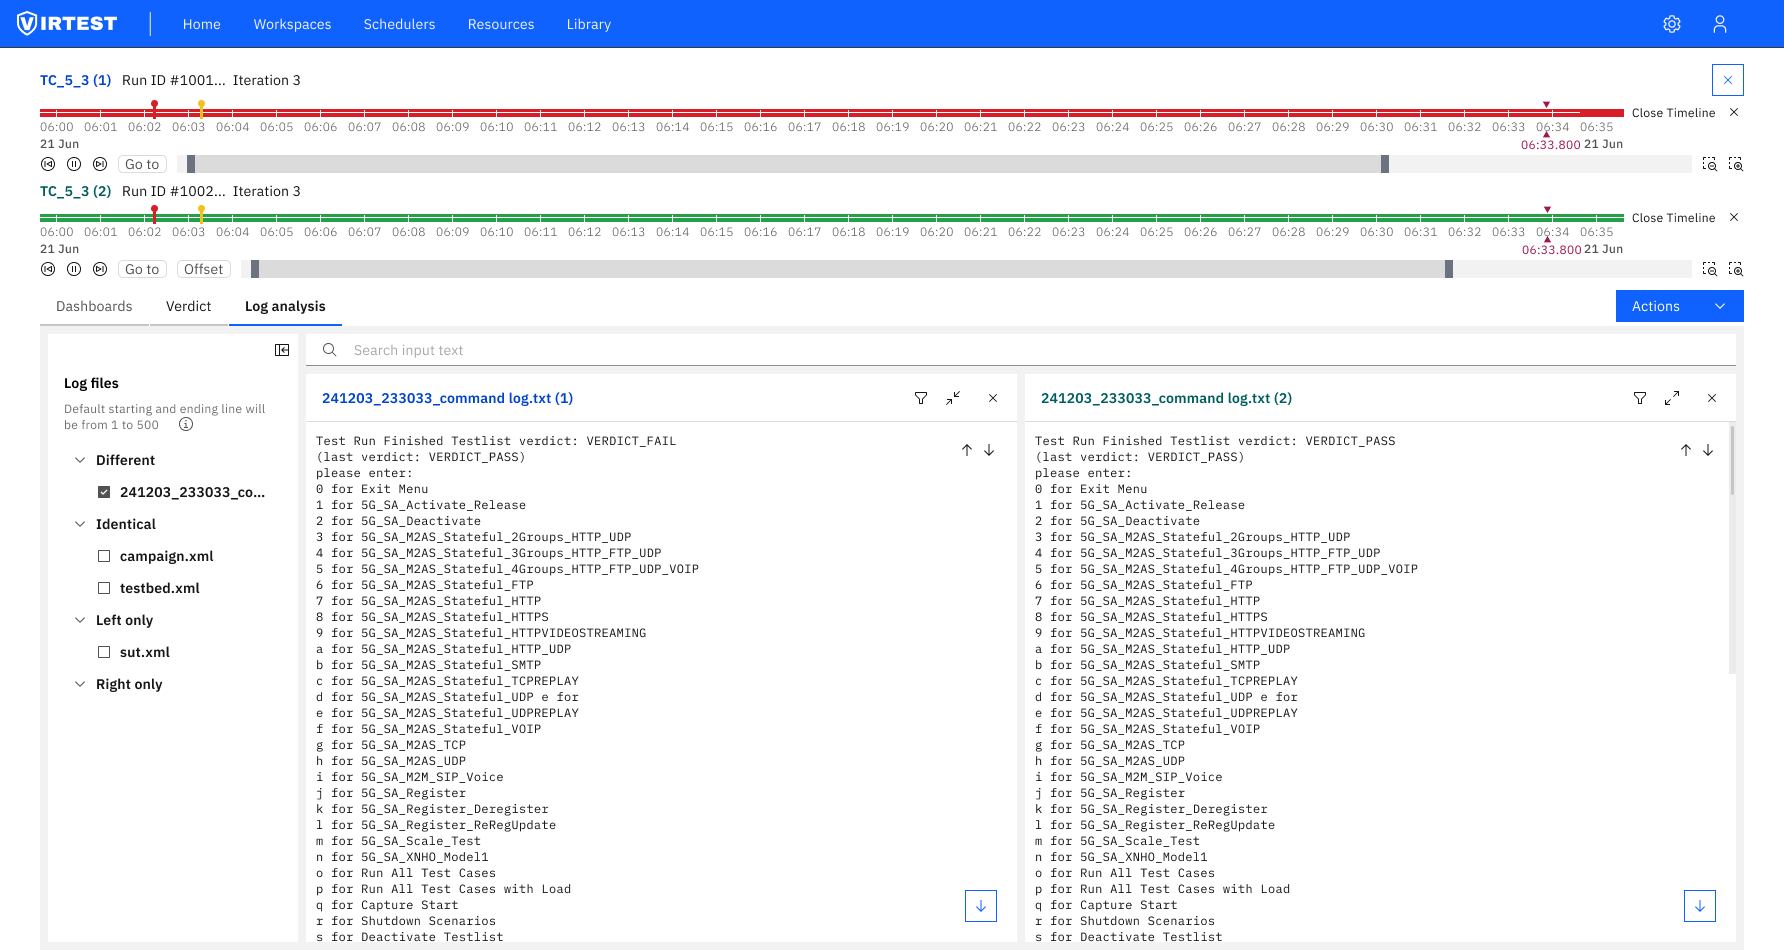
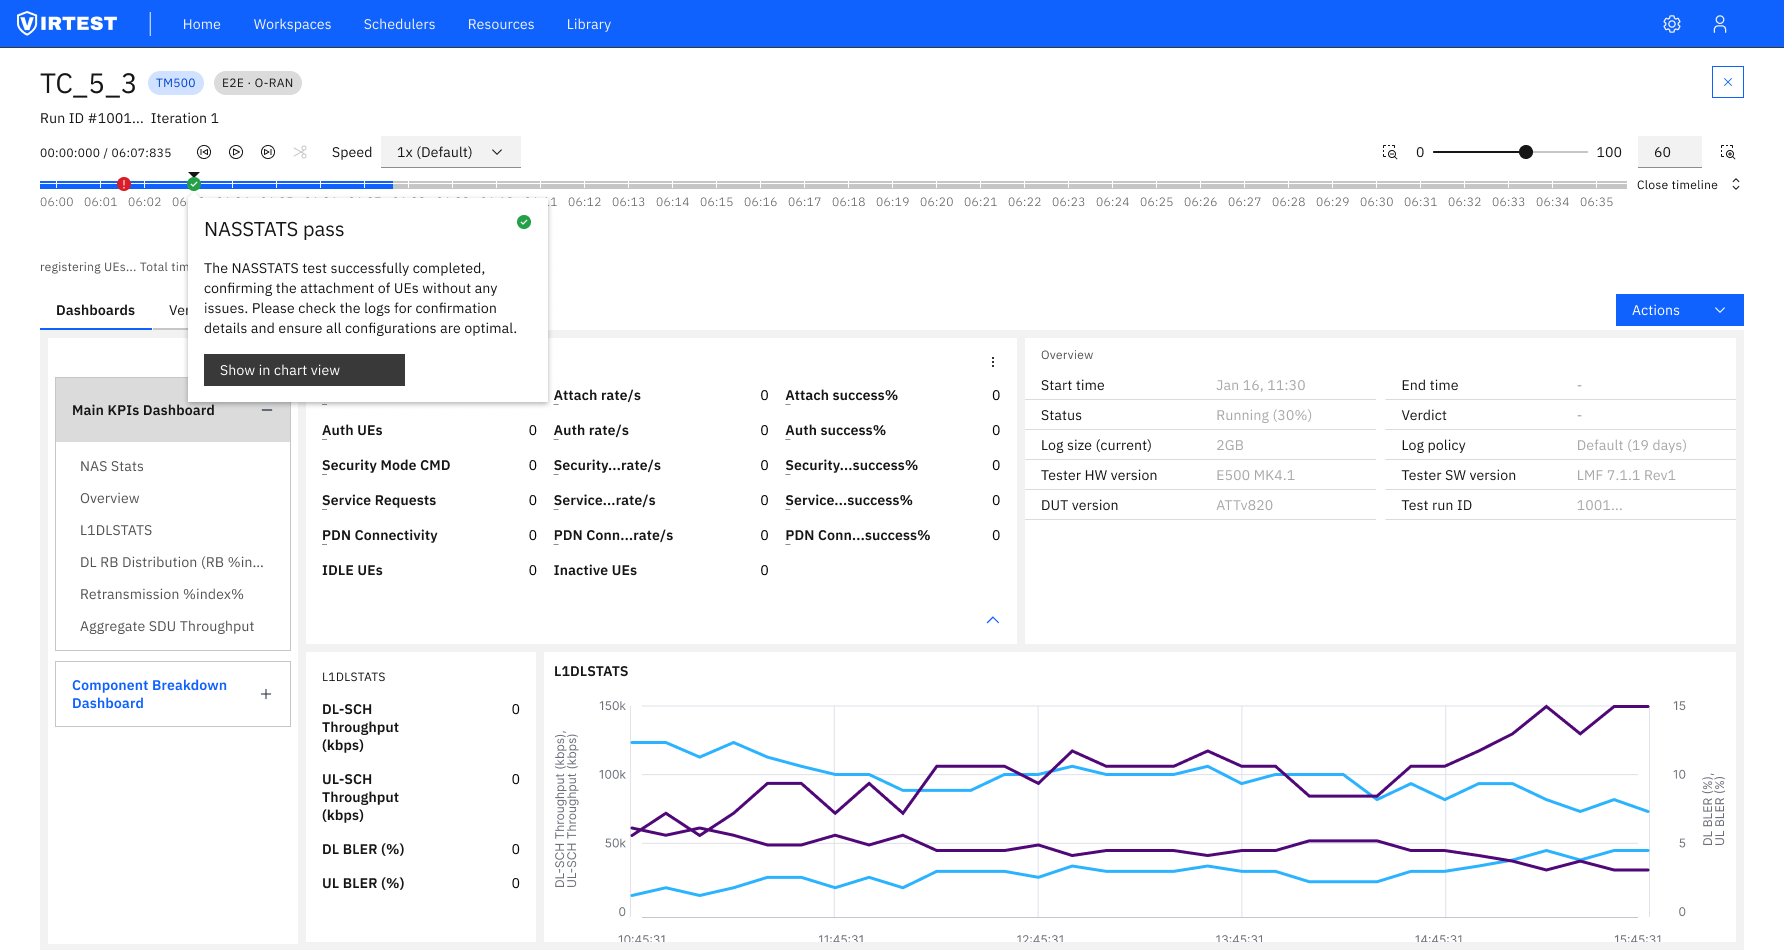
The feature spans three coordinated views: the Test Case Run Dashboard for monitoring active and completed runs in real time, the Log Analysis panel for inspecting raw log output inline, and the Comparison Analysis screen for overlaying results from different test iterations side by side.
When a test failed, engineers had to piece together what happened from separate tools. Log files (sometimes 44MB or larger) had to be downloaded and opened in an external viewer. Verdicts from different test runs lived in separate tabs or spreadsheets with no shared timeline. Finding the exact moment a failure occurred meant scrolling through thousands of timestamped lines with no filtering.
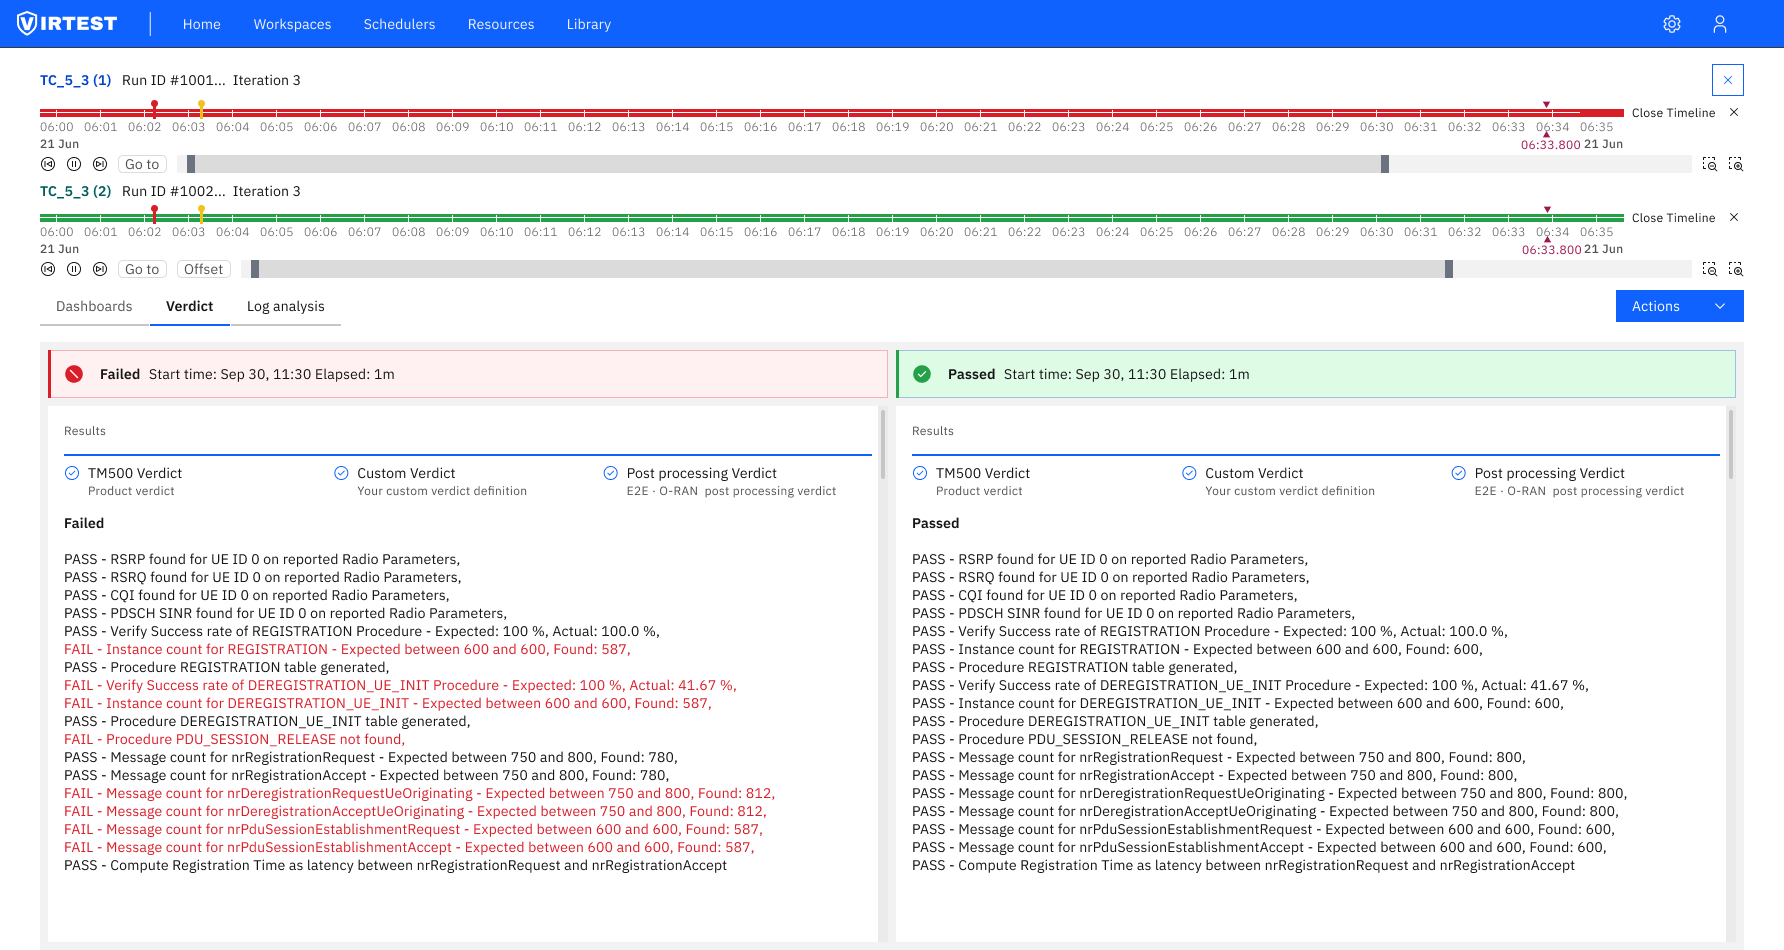
The comparison problem compounded this. Understanding whether a result was a regression, a configuration difference, or environment noise required holding two test runs in memory simultaneously, something the platform had no support for. Engineers normalized this manual workflow because there was no alternative inside VIRTEST.
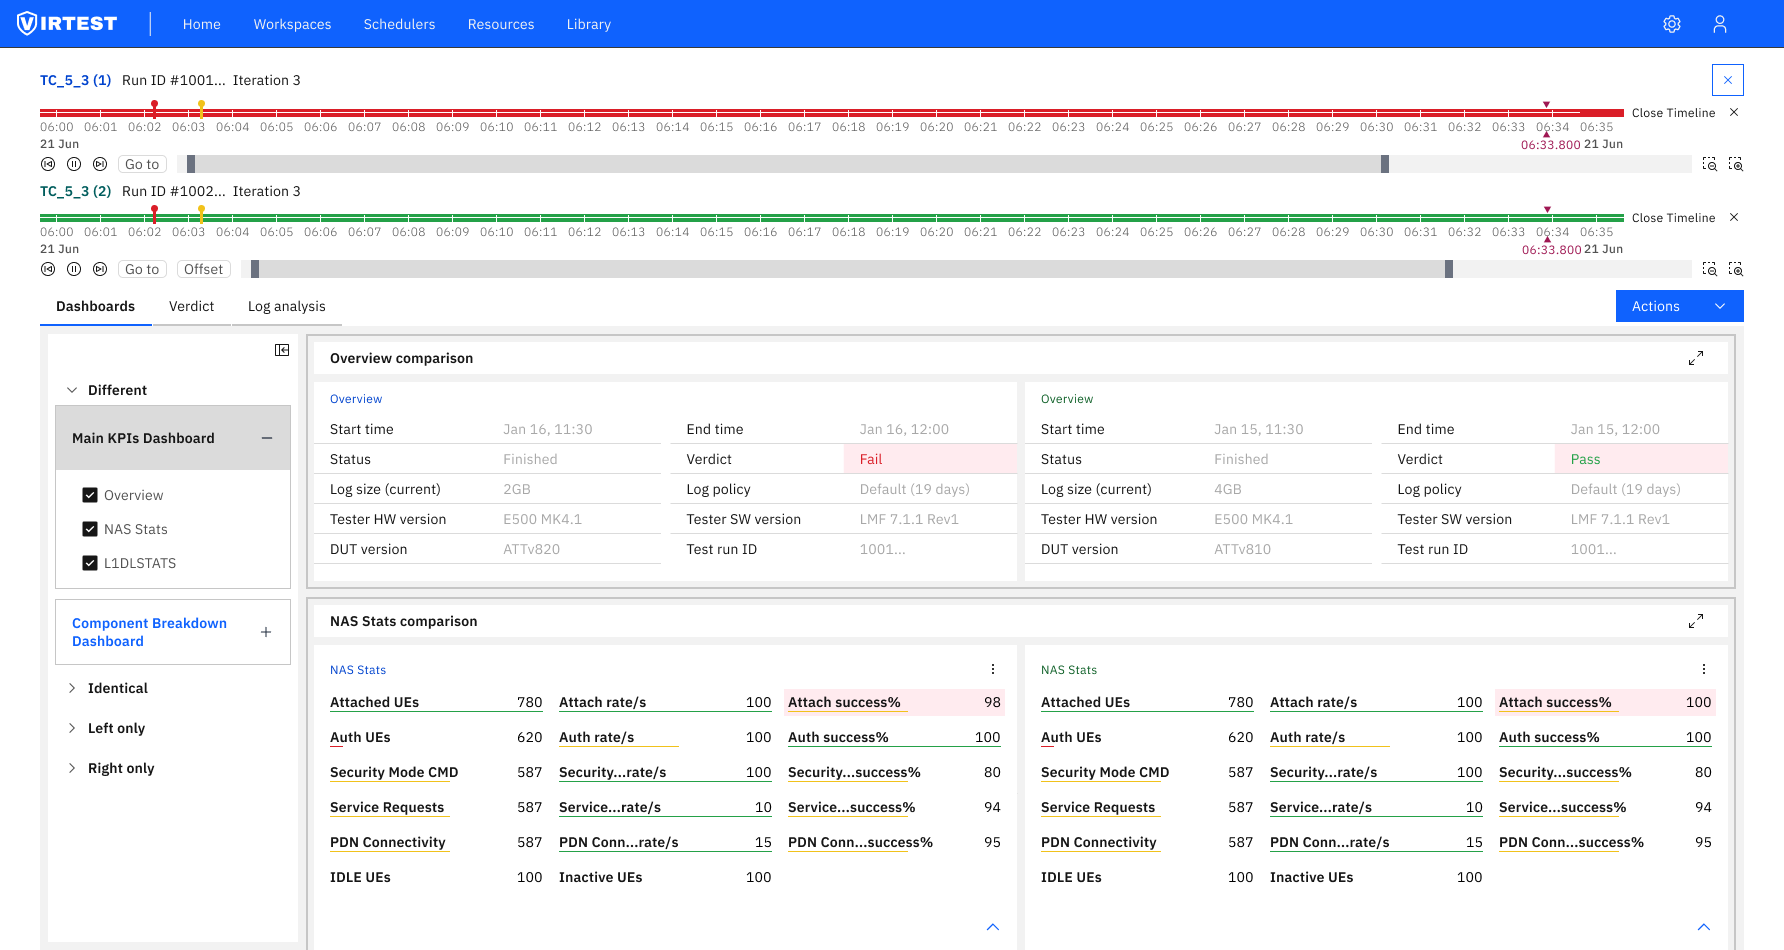
The solution organizes comparison into a three-view workflow accessible from the Scheduler. Engineers move naturally from monitoring runs to inspecting logs to comparing results, without context-switching out of the platform.
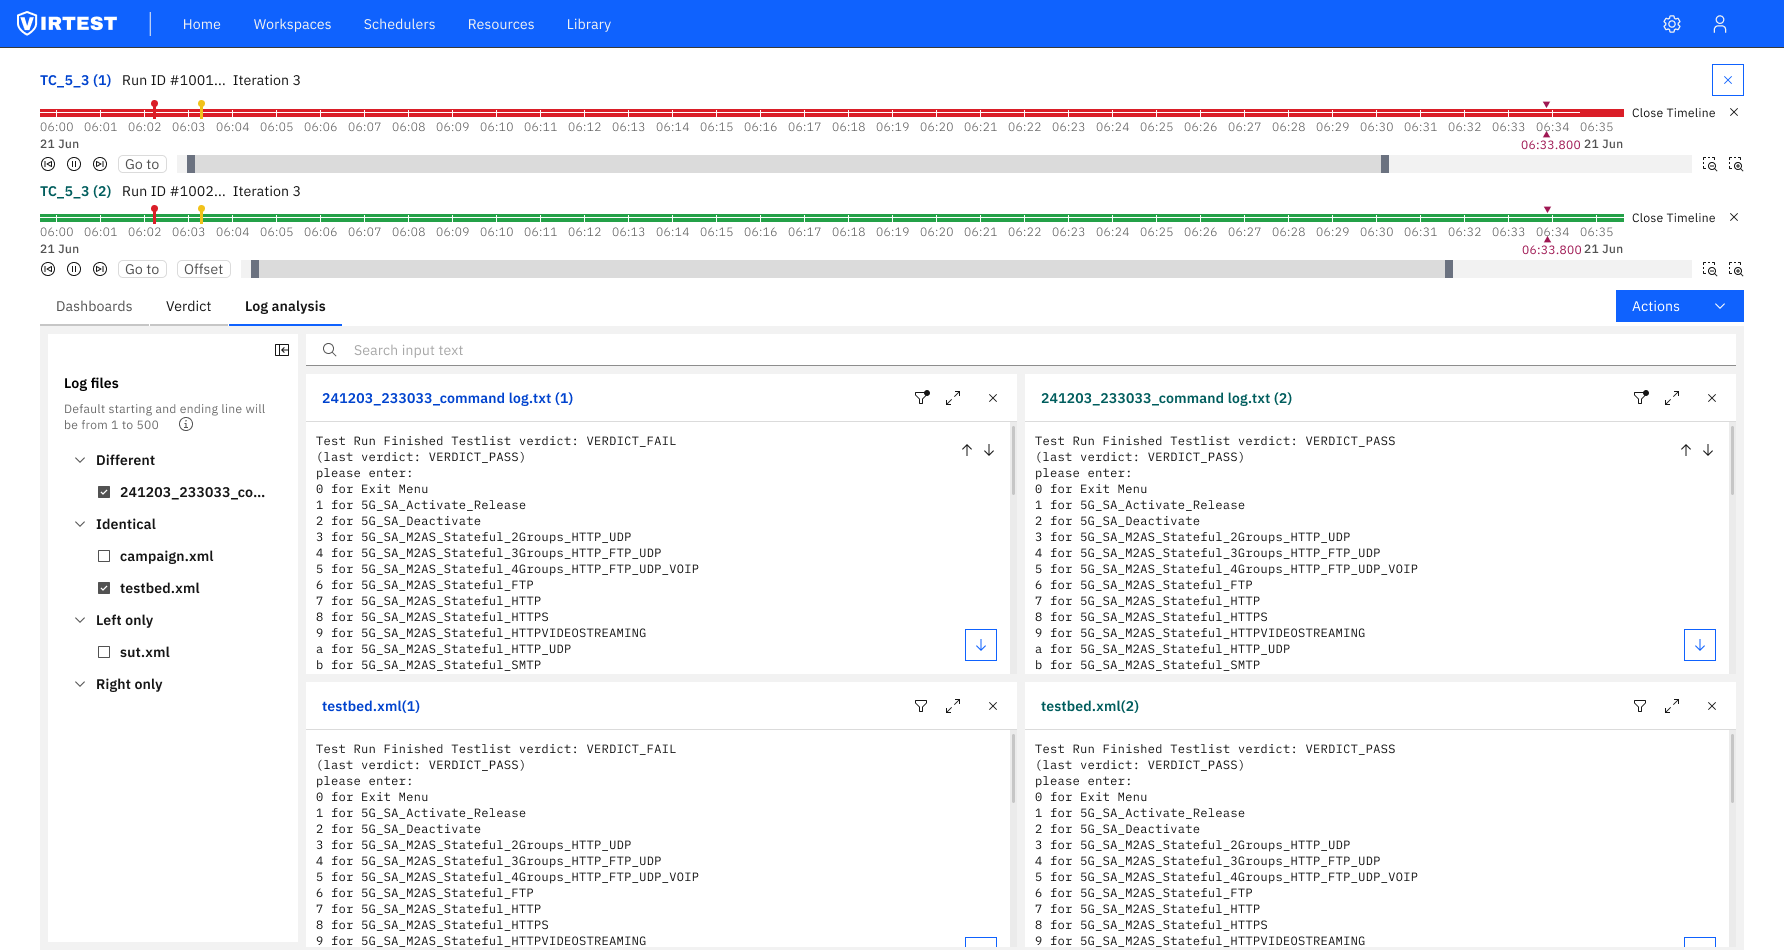
Inline log analysis. Rather than linking engineers to a download, log content is rendered directly in the platform. The primary decision was making large files (44MB+) readable without pagination, a virtualized list keeps scroll performance stable regardless of log size.
Status clarity before action. Early iterations used color dots for run state. Engineers still hovered to confirm what a color meant. Replacing dots with explicit text labels: "Queued & Running", "Finished", made state readable at a glance across dense dashboards without any tooltip dependency.
Millisecond timestamp precision. Log entries display full timestamp precision (11:33:24.125) because telecom test failures frequently occur in sub-second windows. Rounding to seconds, as earlier designs did, concealed the exact failure point and sent engineers back to raw files anyway.
Compare Tool eliminated the most time-consuming step in post-run analysis: downloading log files and cross-referencing verdicts manually. Engineers could move from a failed run to its root cause without leaving the platform, reducing the investigation cycle significantly for teams running multiple test cases per day.
For the product, Compare Tool strengthened VIRTEST's position as a complete test platform rather than a test execution engine. Bringing analysis into the same interface as execution closed a workflow gap that had routinely pushed engineers to third-party tools, fragmenting the test record and making post-mortem documentation harder to trace.
"Bringing log analysis into the run view wasn't about adding features, it was about removing the context switch that broke engineers' focus every time a test failed."
Context switching is a hidden cost. Engineers hadn't asked for inline log analysis, they'd normalized the external-tool workflow. Once we mapped the full post-failure workflow and counted the steps, the cost became impossible to ignore. Designing for the complete workflow rather than just the primary action had a bigger impact than any interface refinement.
Dense data needs hierarchy, not reduction. Log files contain thousands of lines. The challenge wasn't displaying the data, it was making the critical lines findable. Timestamp anchoring, protocol filtering, and verdict-first layout made dense output navigable without hiding anything engineers actually needed.
Status labels outperform status icons. Color-coded indicators looked cleaner in early designs but required learned mapping. Explicit text labels ("Queued & Running", "Finished") communicated state without any prior context, critical for a tool used by engineers across different specializations who don't all carry the same visual vocabulary.