Signal Tracer is a feature within the VIRTEST platform that enables telecom engineers to model 3D RF (radio frequency) propagation, simulating how radio waves behave inside real environments like office buildings, warehouses, or stadiums before a device ever touches a physical lab.
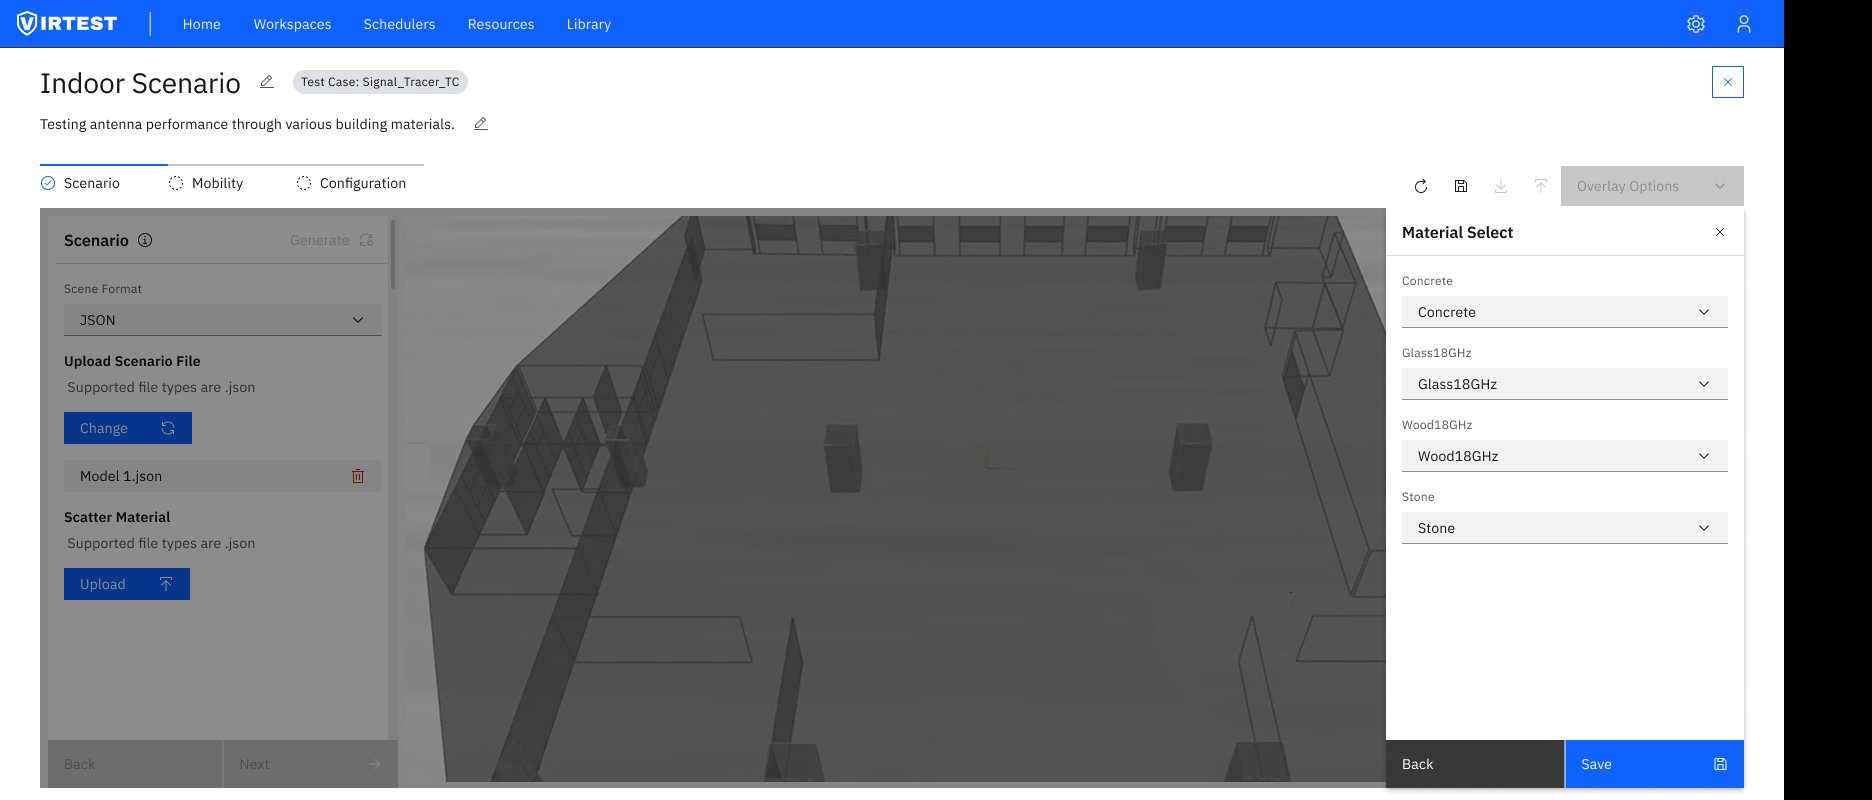
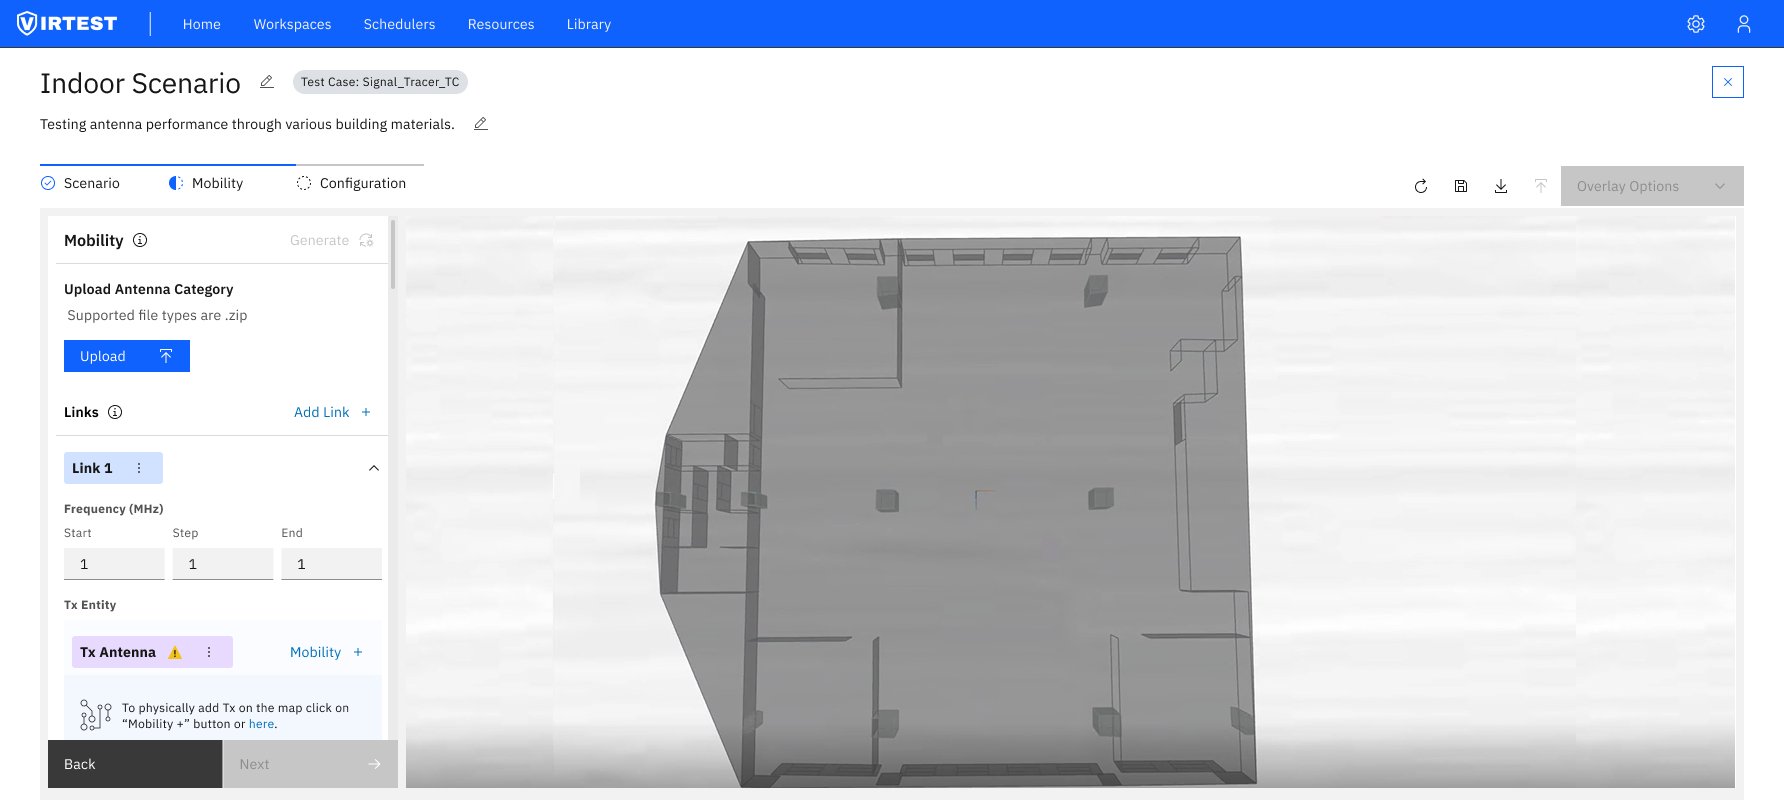
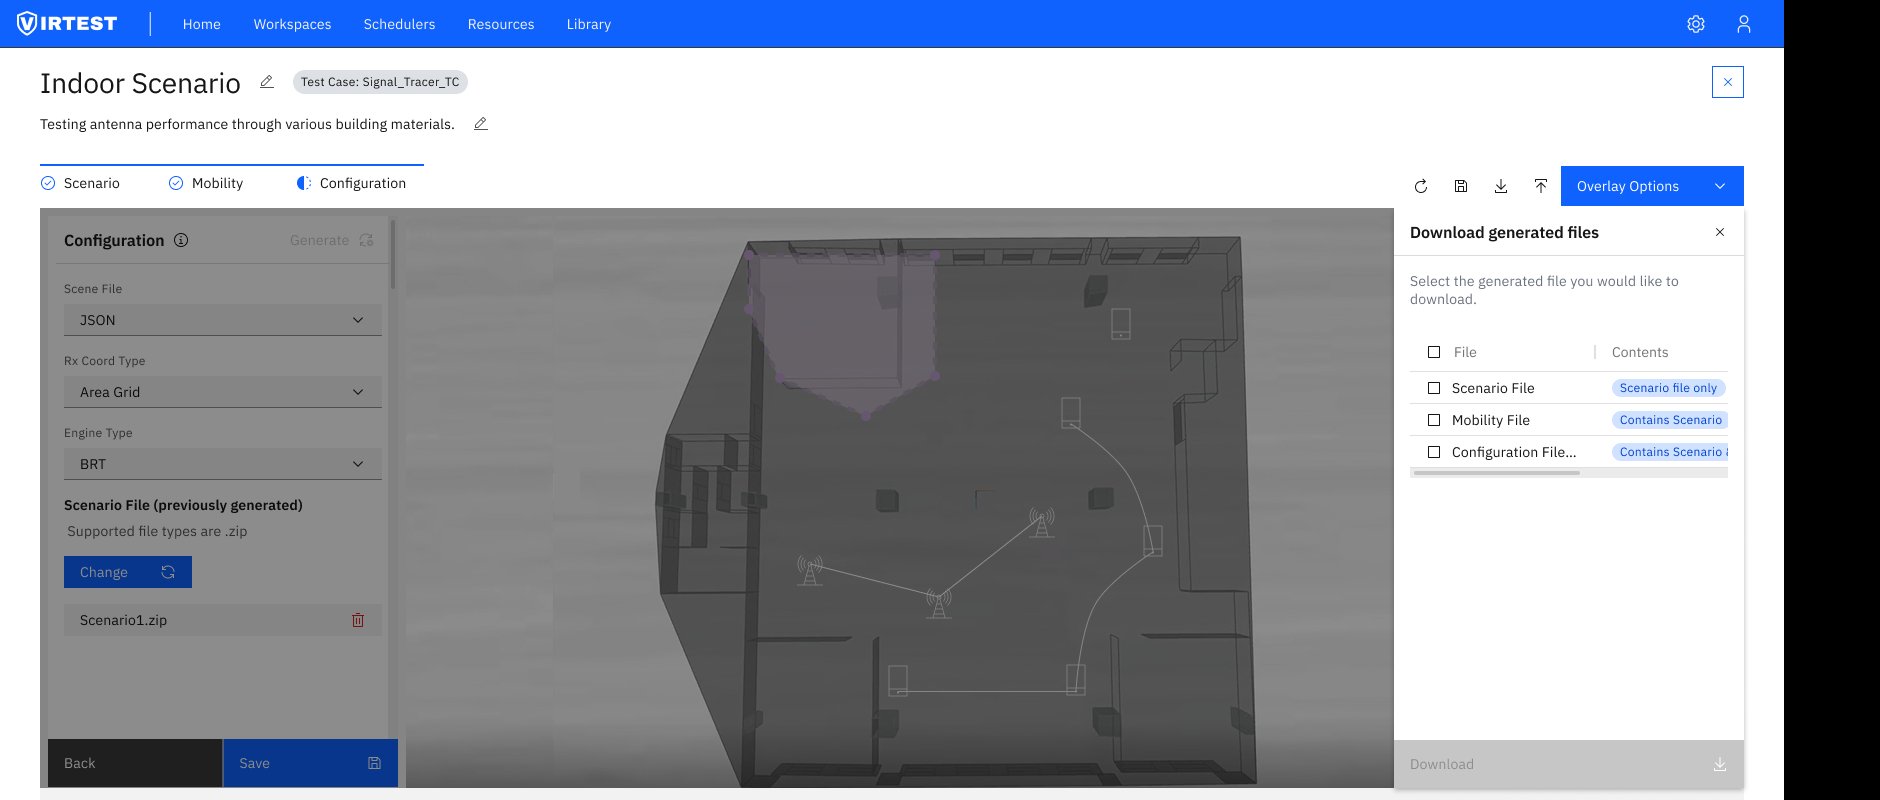
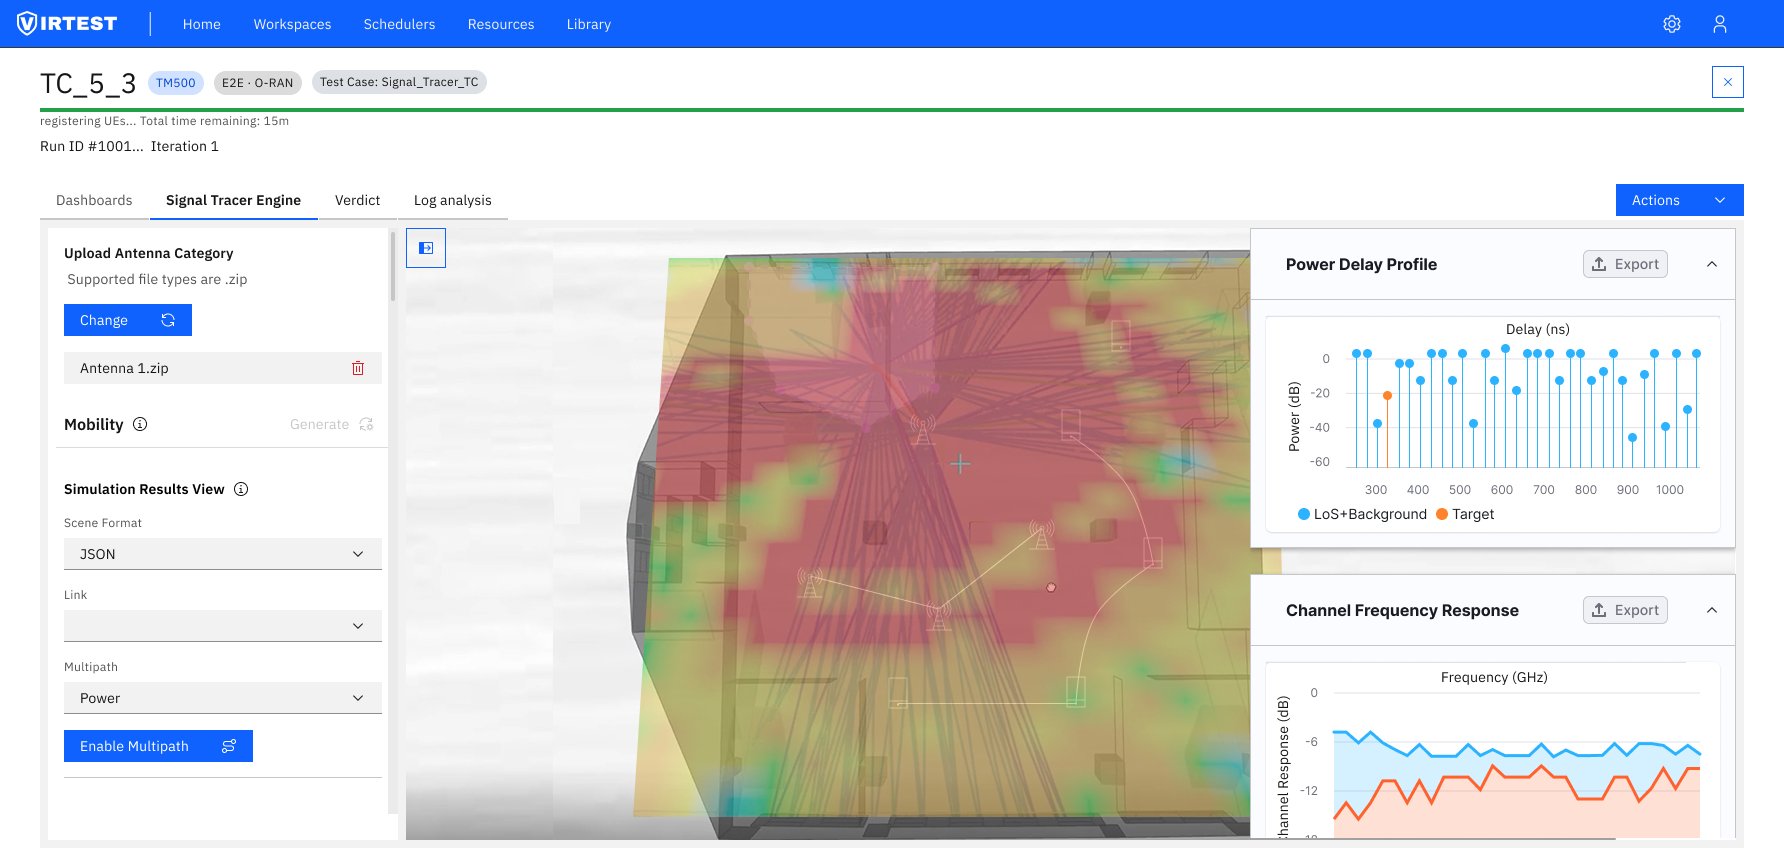
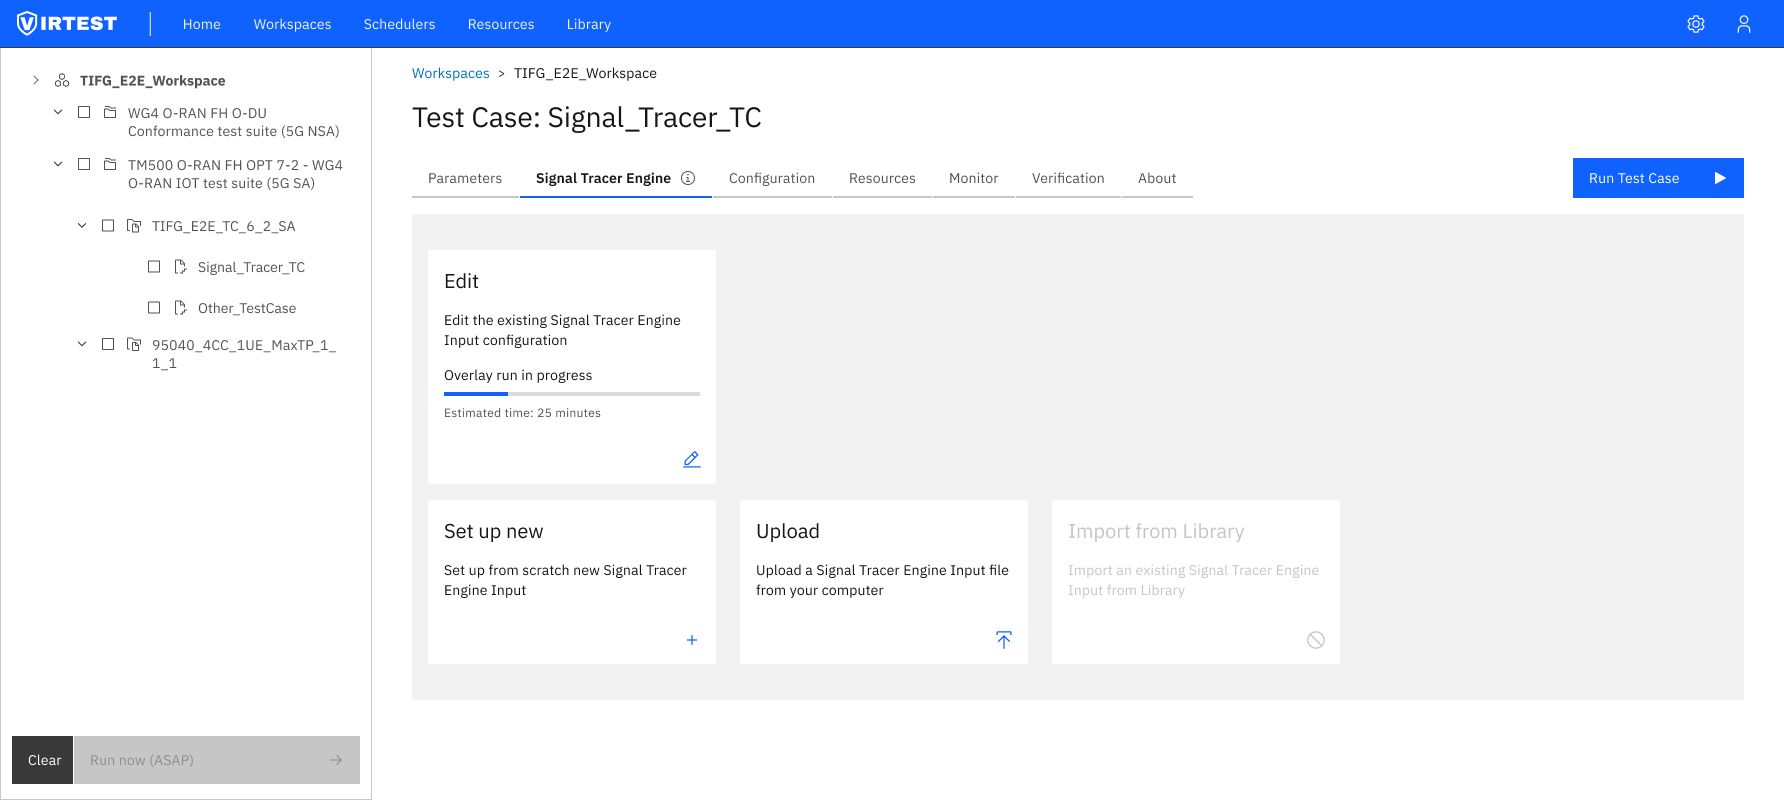
The feature covers the full testing workflow in three sequential steps: Scenario Setup (uploading a 3D environment model and assigning materials), Mobility Configuration (placing and routing TX/RX antennas), and Engine Configuration (setting propagation parameters and running the simulation). Results are visualized as a real-time RF heatmap overlaid on the 3D scene, alongside Power Delay Profile and Channel Frequency Response charts.
RF propagation modeling is technically demanding, the underlying physics involves frequency bands, reflection coefficients, scattering patterns, and antenna gain patterns. Existing tools required deep domain expertise just to start a test, creating a significant barrier for engineers who weren't RF specialists.
The challenge was to design a workflow that didn't hide the complexity (engineers need that depth), but didn't require mastery of it upfront either. Progressive disclosure was the core design principle: show the essential configuration first, let experts go deeper when they need to.
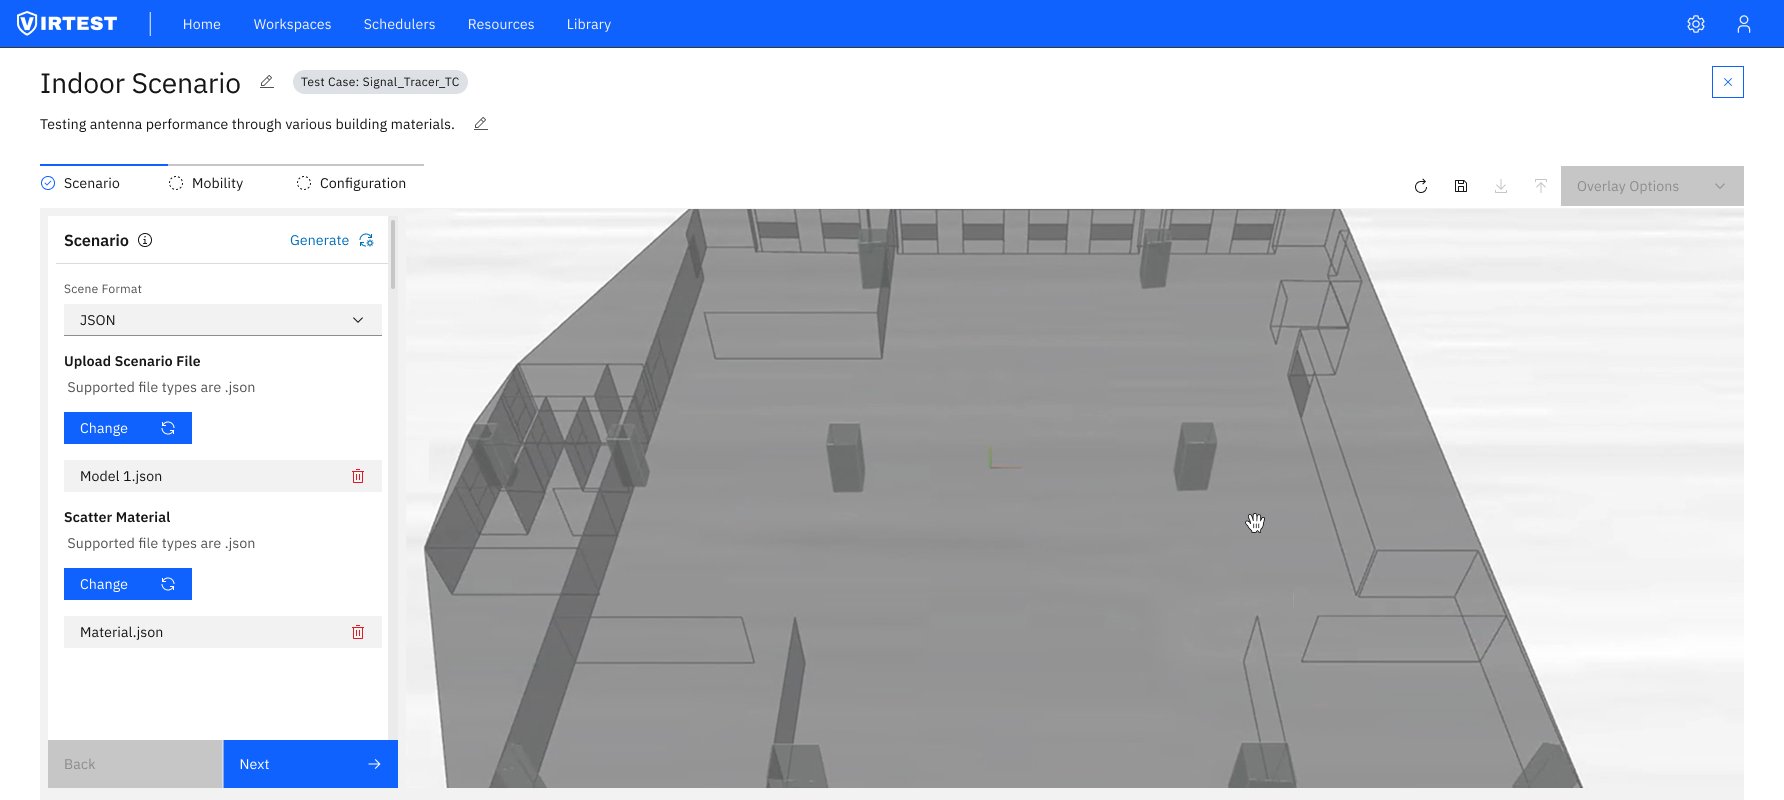
The solution is a three-step wizard that maintains a persistent 3D viewport throughout. The left panel changes with each step while the scene remains anchored, users never lose their spatial context.
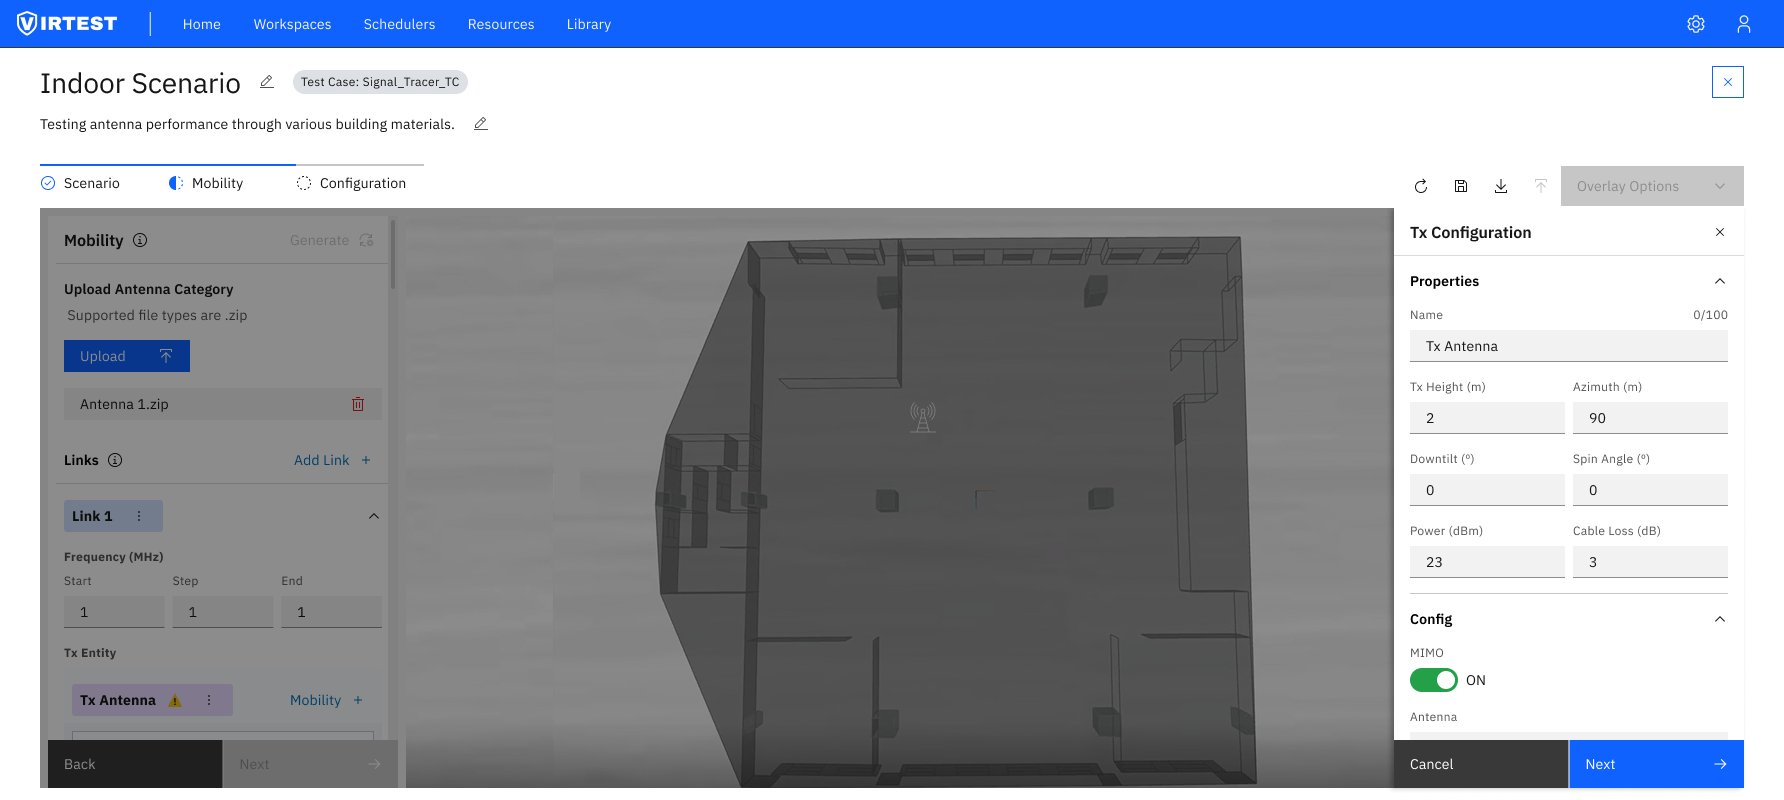

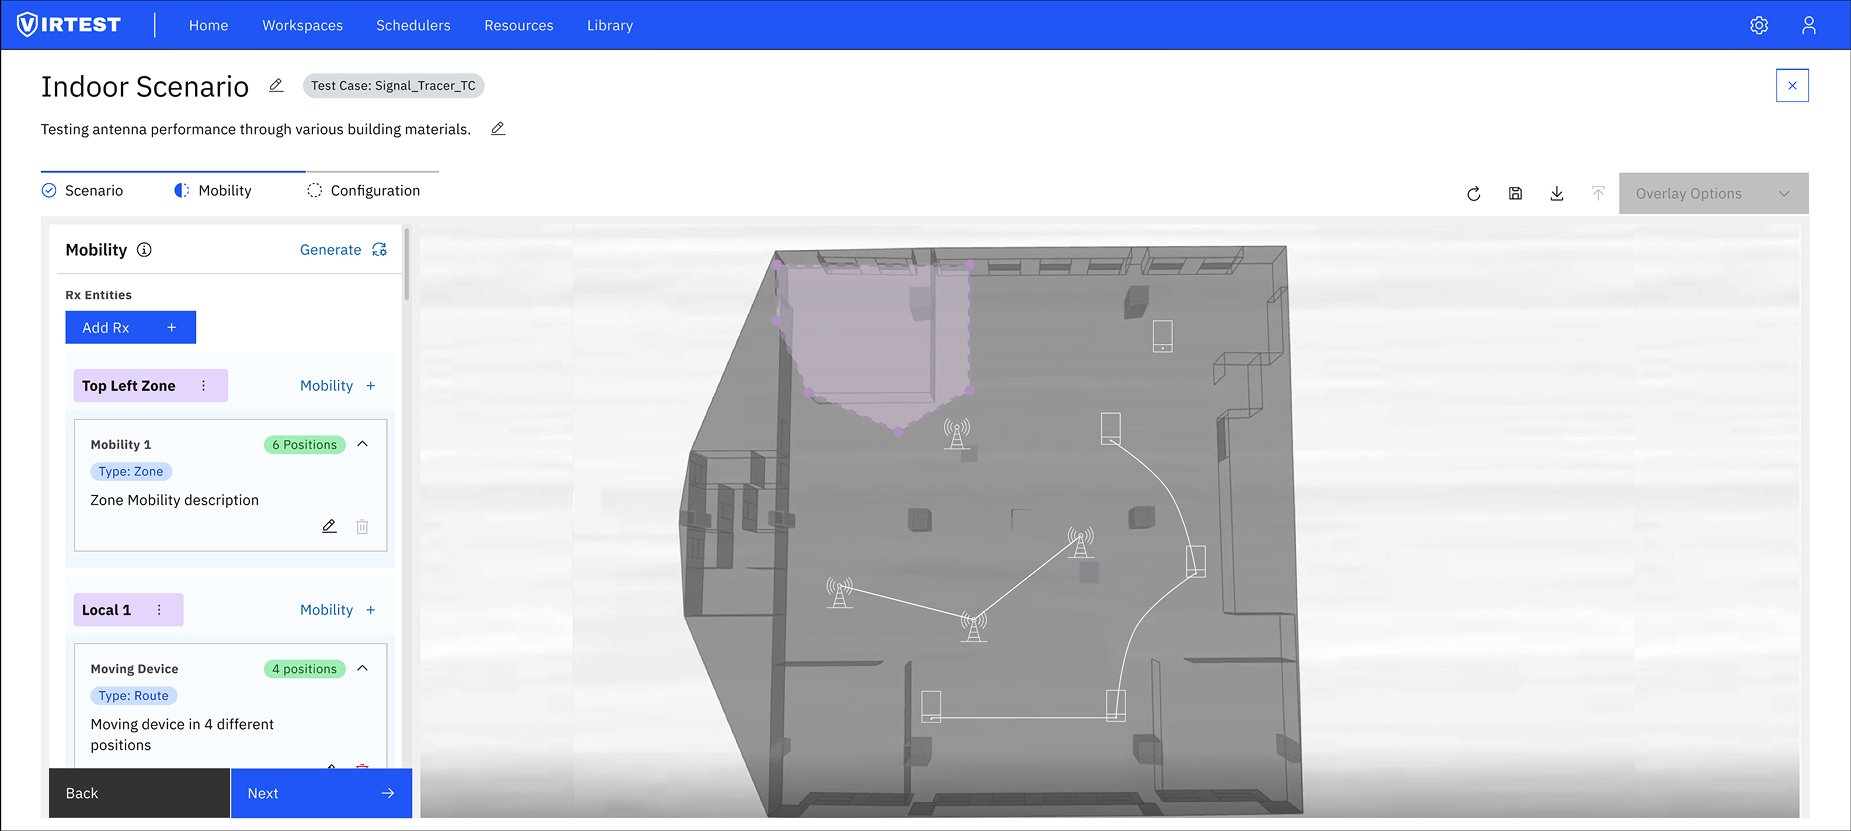
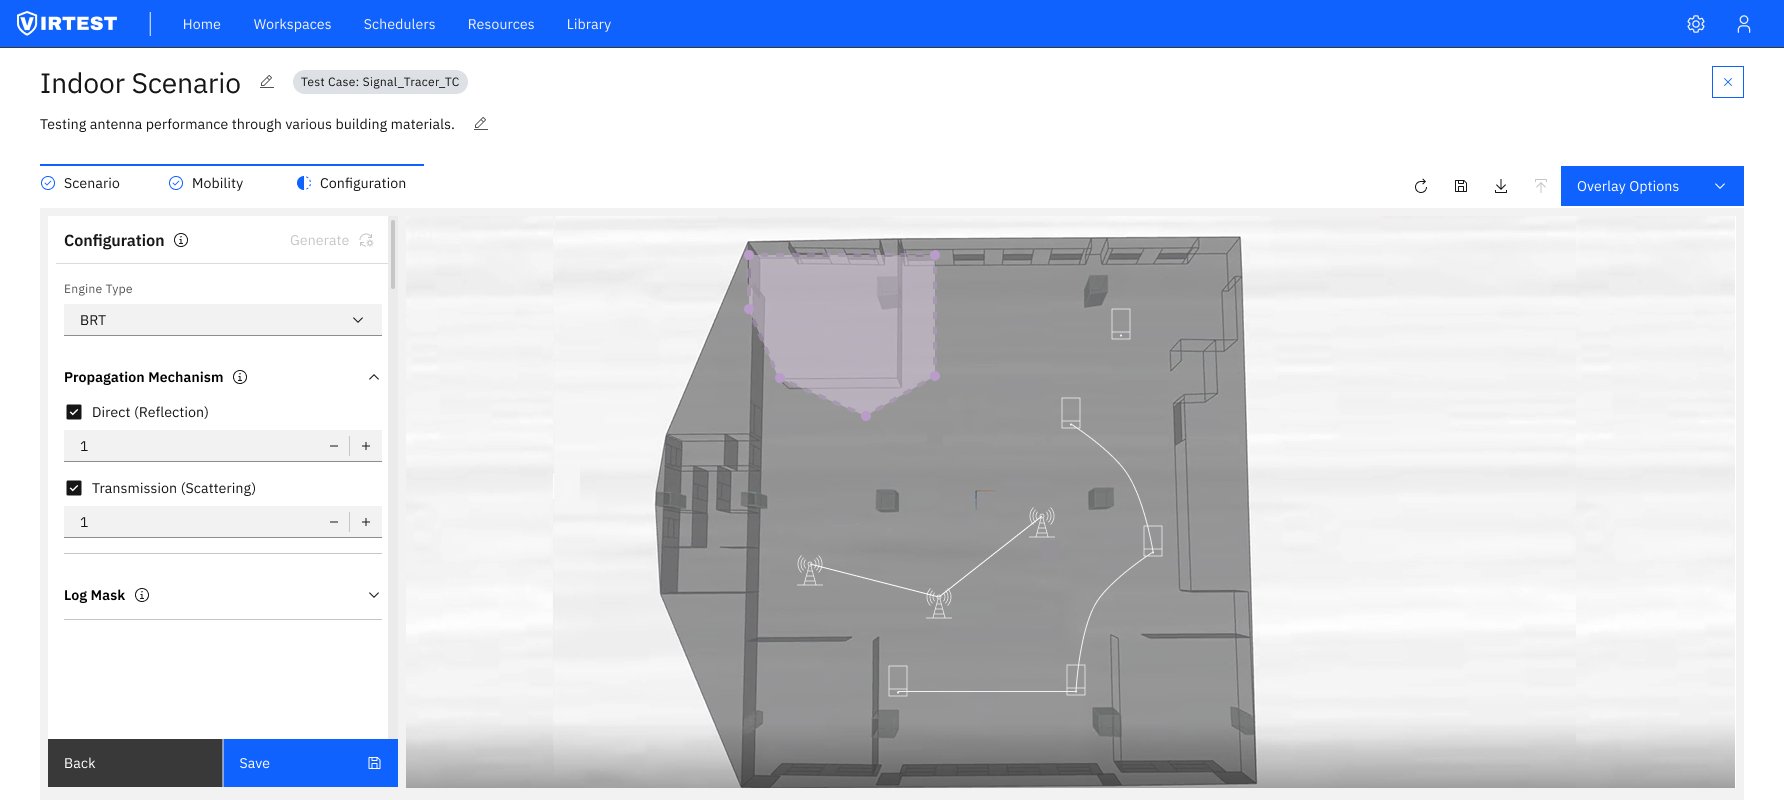
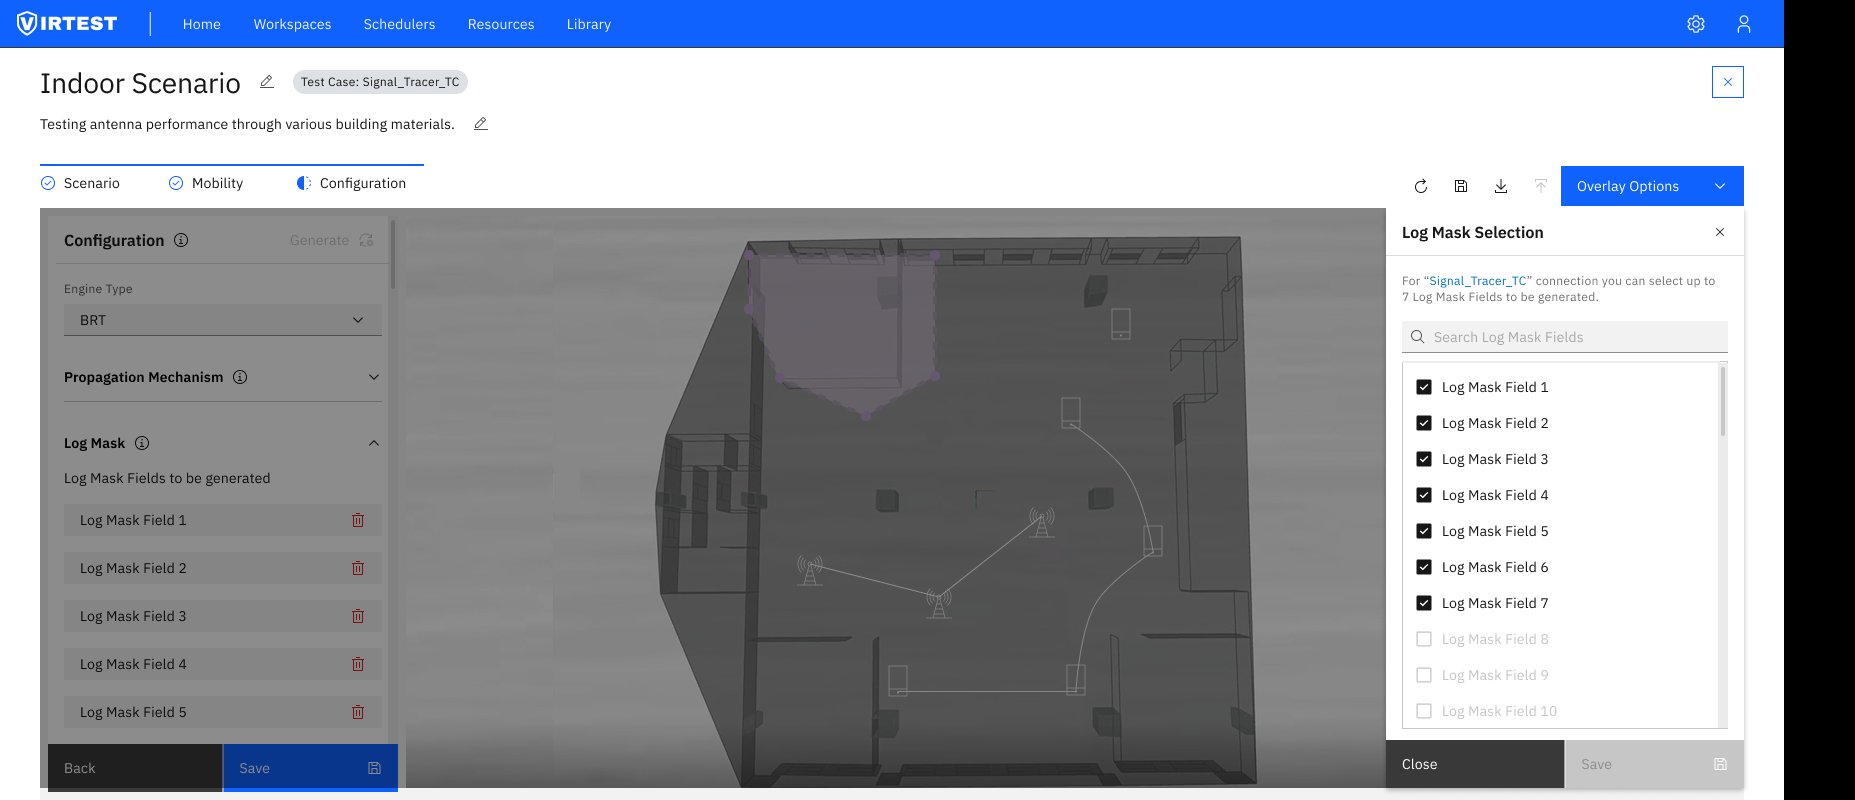
Persistent 3D viewport. The scene stays visible across all three steps. This was a deliberate choice against a purely form-based wizard, spatial tools need spatial feedback. Users configure, then immediately see the effect on the model.
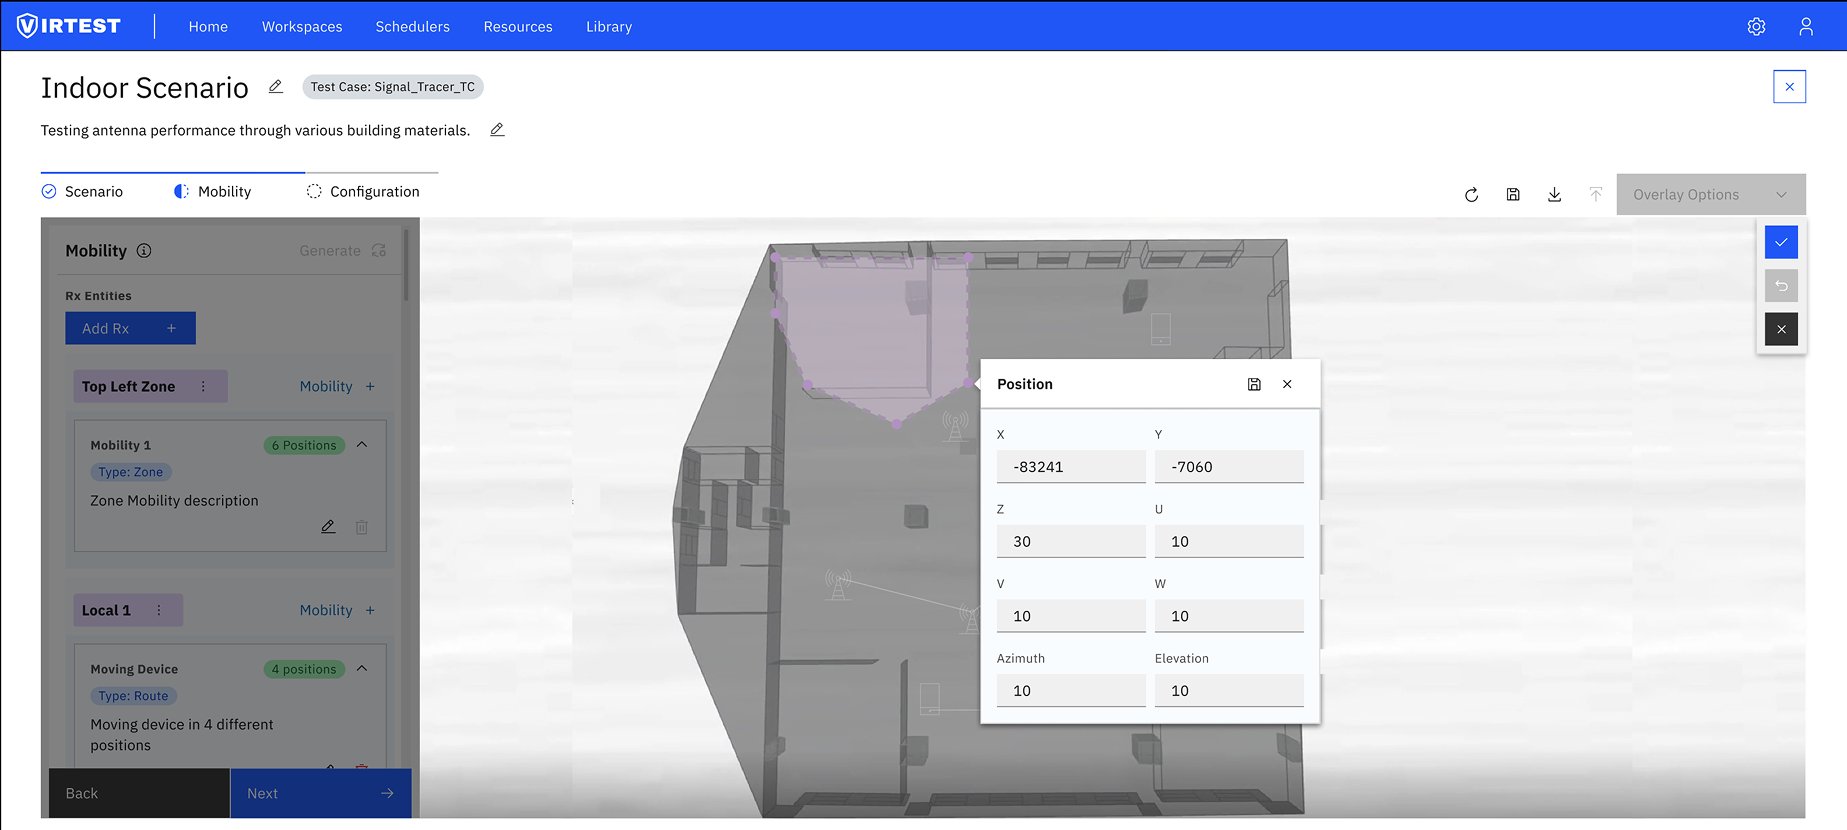
Inline position editing. Clicking an antenna on the 3D map opens a position panel directly, with X/Y/Z coordinates, azimuth, elevation, and beam width. Values can be typed or adjusted by dragging on the map, whichever is more precise for the task at hand.
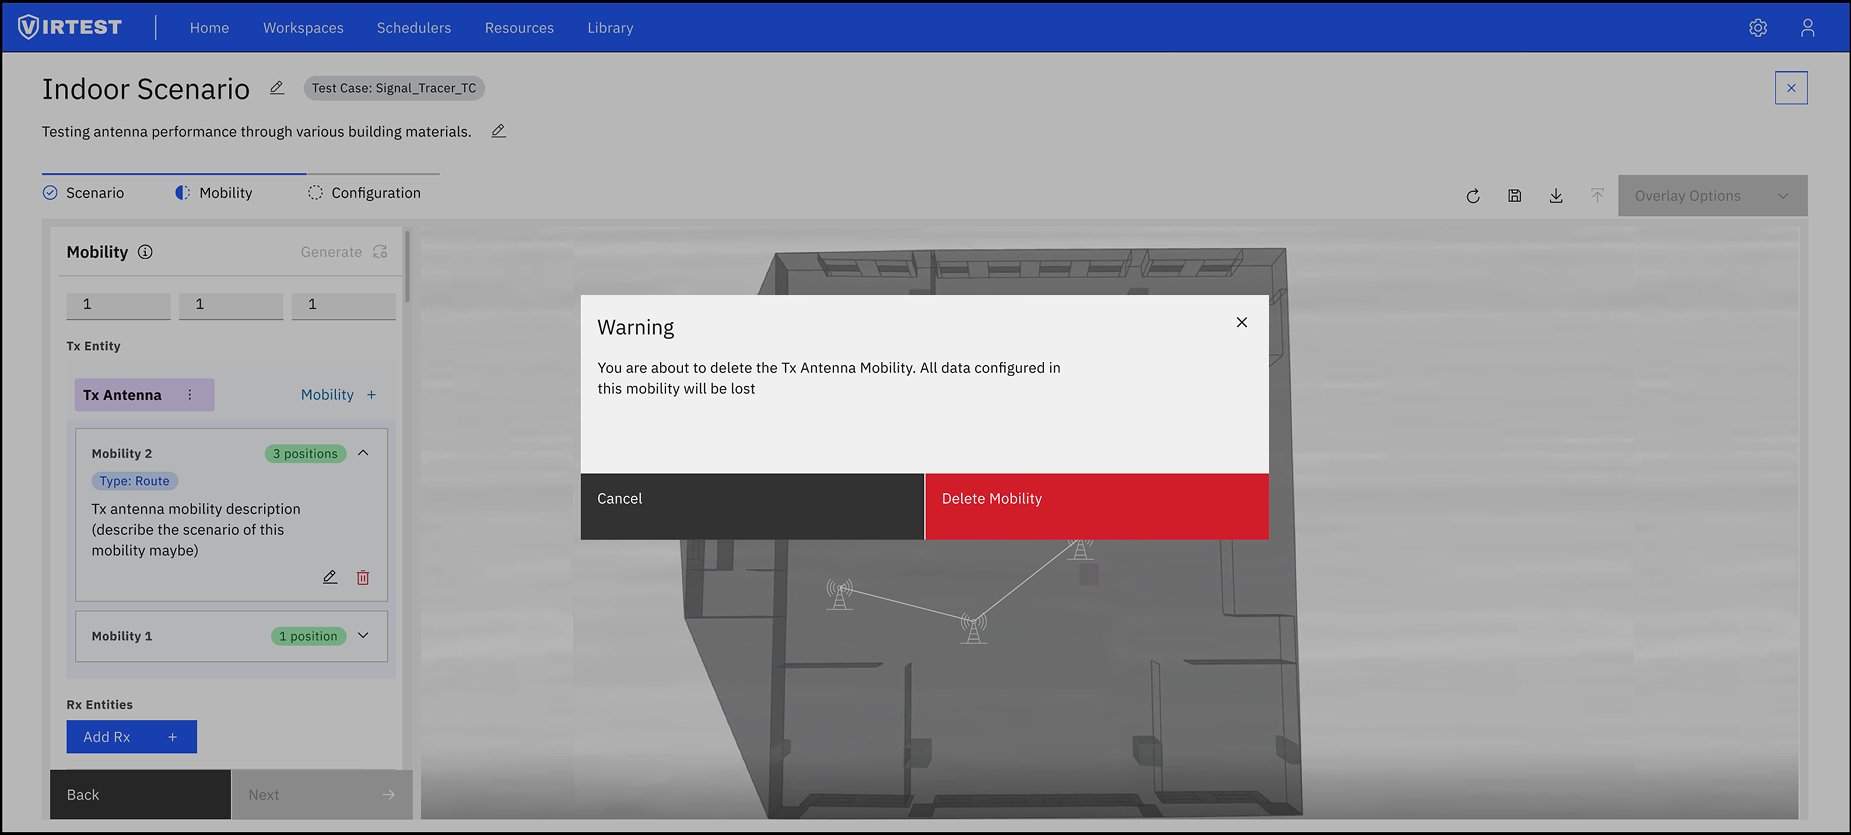
Destructive action protection. Deleting a mobility configuration triggers a clear warning modal: "All data configured in this mobility will be lost." A single red "Delete Mobility" button forces a conscious decision. This pattern was applied to all irreversible actions in the feature.
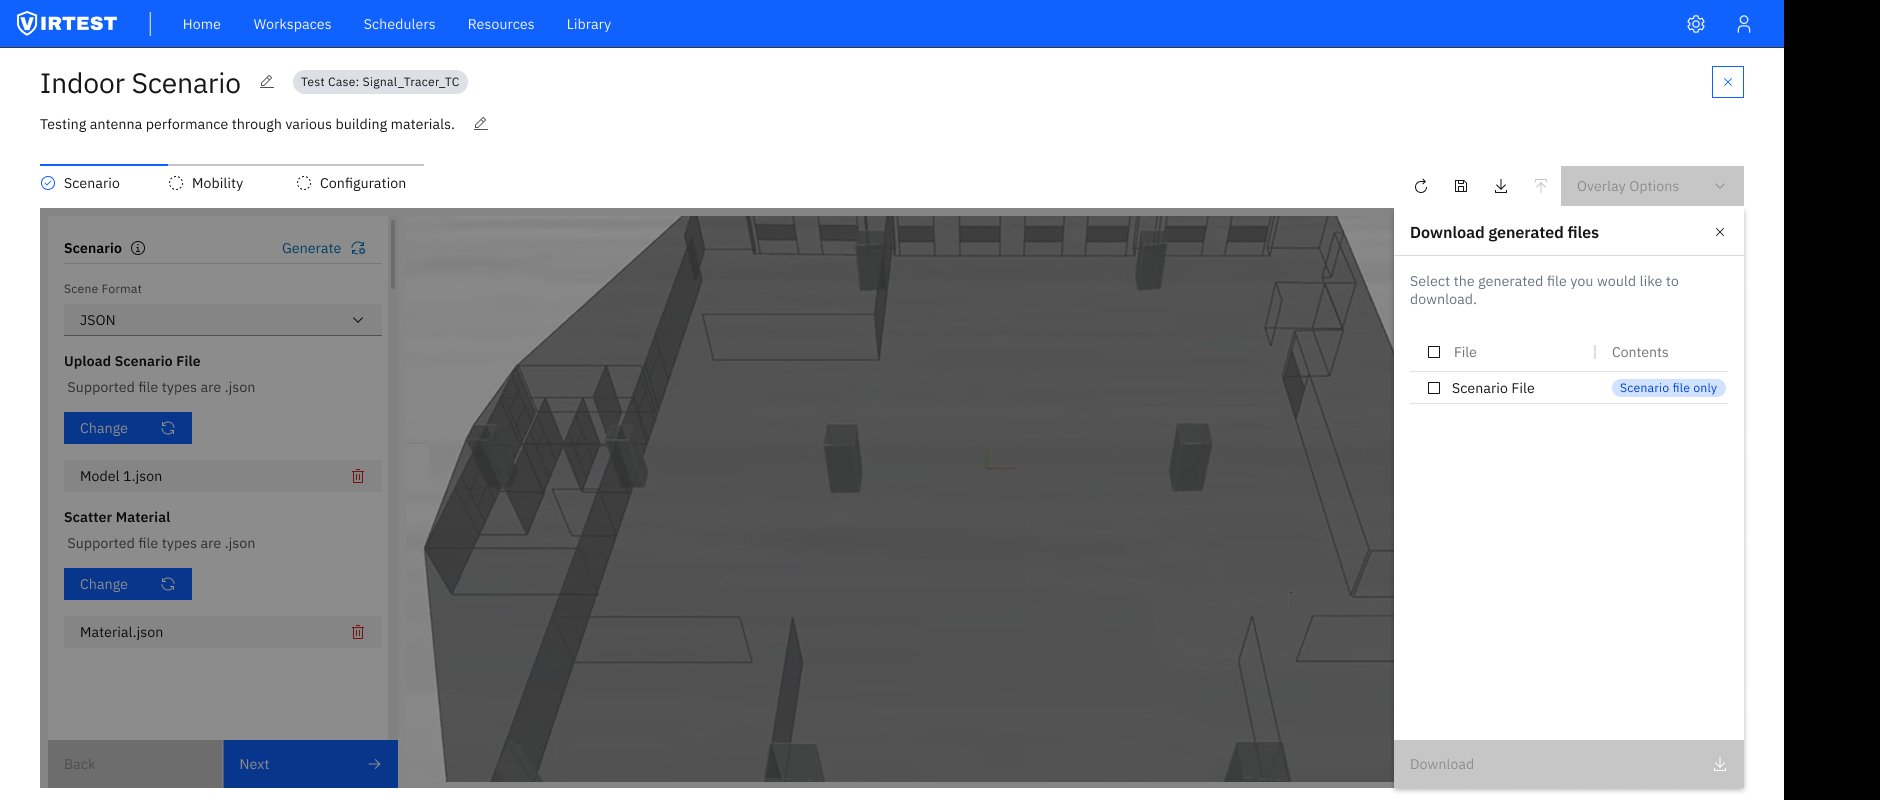
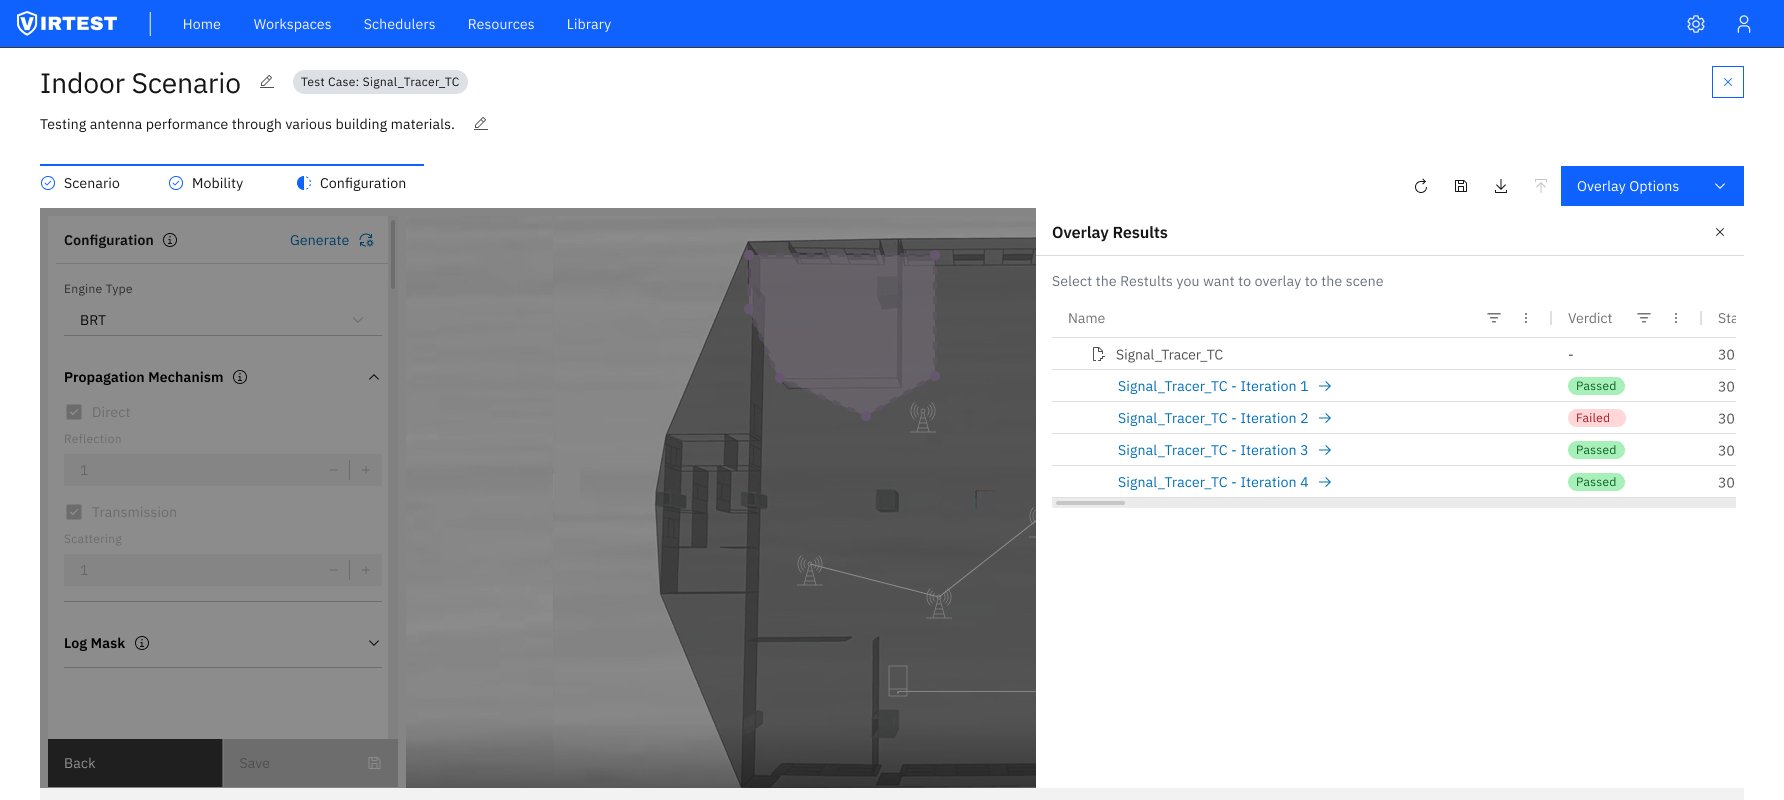
Result overlay on the same scene. Rather than routing users to a separate results view, the RF heatmap renders directly on top of the 3D floor plan used during setup. Engineers can see exactly where signal strength is high or low in relation to the environment they configured.
The feature reduced configuration setup time by approximately 60% compared to the previous workflow, primarily through the guided three-step structure and the elimination of context-switching between configuration panels and the 3D view.
Simplified entry points lowered the barrier for occasional users (engineers who needed to run a signal trace but weren't RF specialists) could complete the workflow without specialist support. Improved error prevention through progressive disclosure and inline validation reduced configuration mistakes at the engine run stage.
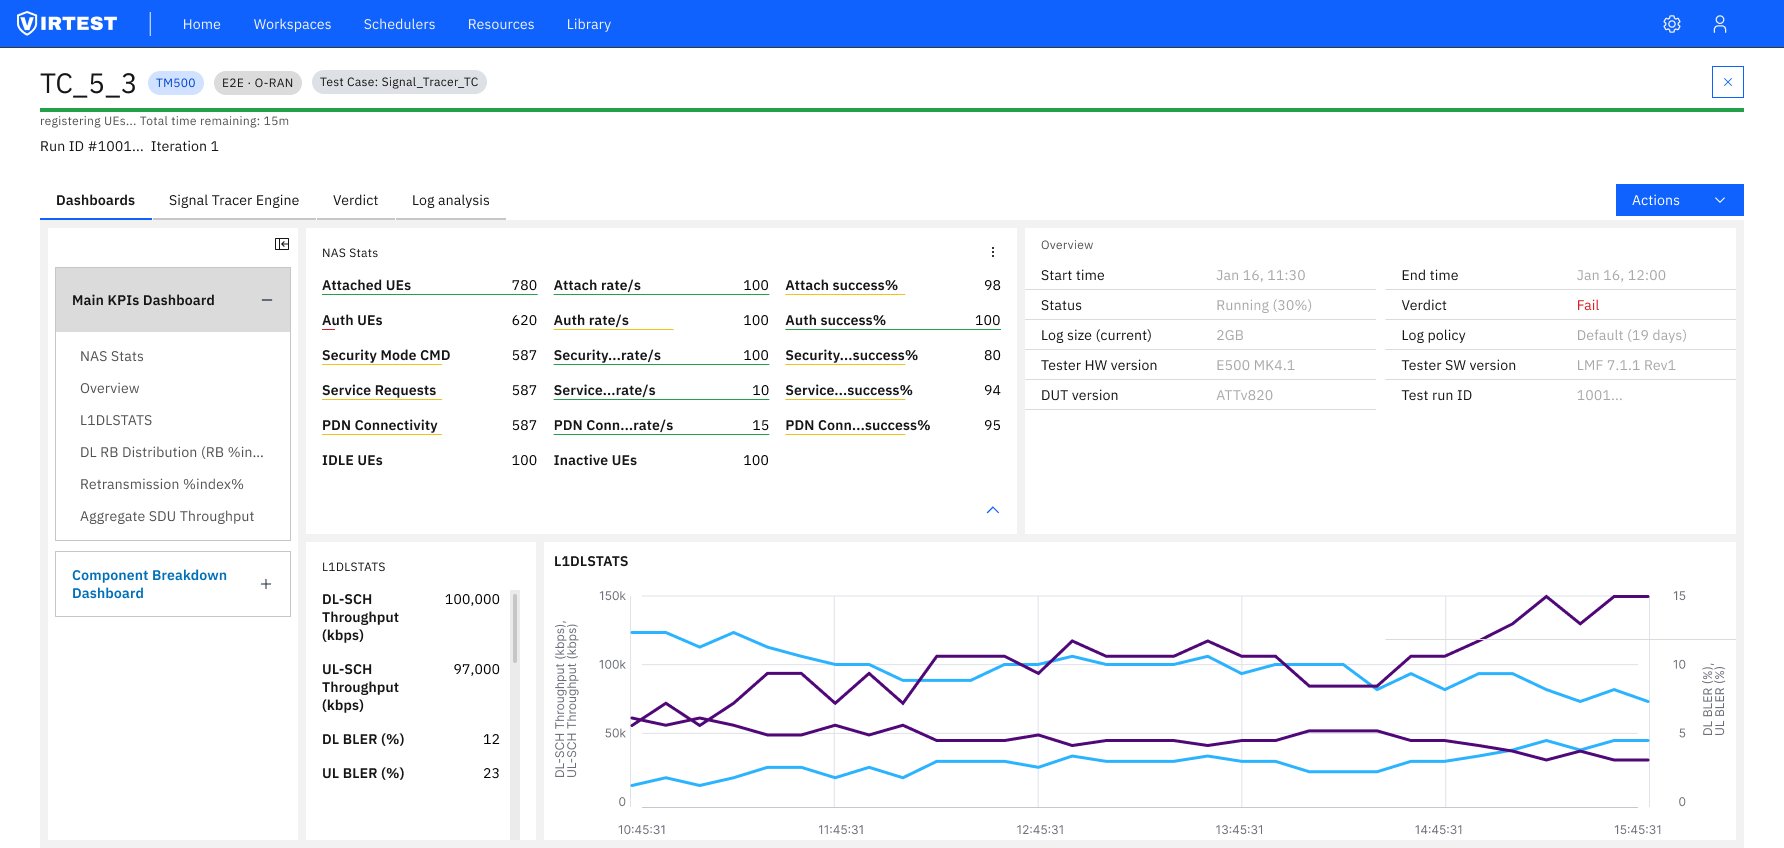
On the product side, Signal Tracer added a differentiating capability to VIRTEST, a live lab visualization that previously required external tools. The integration of results directly into the existing VIRTEST dashboard maintained the platform's consistent patterns and encouraged adoption among users already familiar with the broader system.

"Investing in 3D visualization wasn't just a nice-to-have, it became essential for users to understand their configurations. The topological view reduced configuration errors more than any form validation we added."
Domain complexity requires careful abstraction, not elimination. Early iterations tried to simplify too aggressively by removing options that power users needed. The final approach showed basic options first and surfaced advanced configuration through progressive disclosure, keeping both novice and expert engineers productive.
Integration beats isolation. Rather than building Signal Tracer as a standalone tool, integrating results into the existing VIRTEST dashboard paradigm created familiar patterns and reduced the learning curve. Users didn't need to learn a new mental model, they extended the one they already had.
Visual feedback for long-running processes matters. Simulations can take 25+ minutes to complete. Progress indicators, state visualization, and a clear separation between "configuring" and "running" states were critical for user confidence during waits.